Gold Price Analysis Today | Forex Gold Analysis | XAU/USD Analysis - November 17, 2026

coverImg
Source: DepositPhotos

Today's Gold Price

Gold price chart for today

Get Started >

*0% Commission and Low Spreads 0️⃣

*$50,000 in Free Virtual Funds 💰

*$100 New Customer Bonus 🎁

Gold (XAU/USD) traded near $3,855.57 this morning (November 17, 2026). The dollar index strengthened to 103.52, and a sell-off in tech and AI stocks prompted investors to cut risk across asset classes. The probability of a December Fed rate hike was nearly 100%, even as the 10-year Treasury yield slipped to around 5.12% and crude oil fell more than 3%. Today's focus is whether gold can hold $3,855–3,870 and form a higher low.

Today's Key Points

Key Points
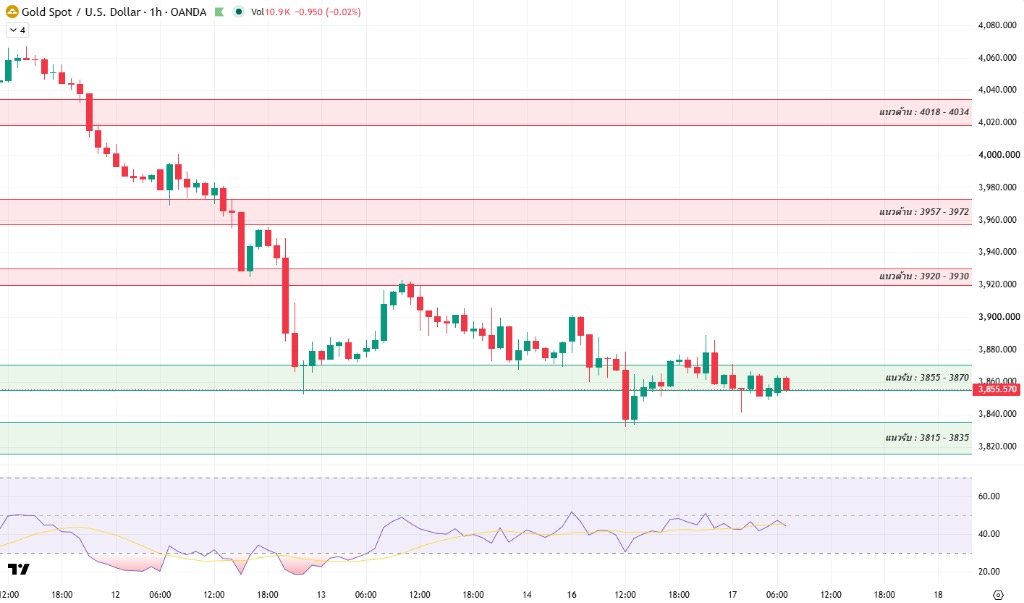
  • Today's price outlook: Gold is holding near the lower end of support at $3,855–3,870 after sweeping liquidity near $3,832. If it holds above $3,855, it could test $3,920–3,930. A break lower could send it toward $3,815–3,835.
  • Top news: The dollar index climbed to 103.52, pressuring gold toward $3,855, while silver fell 3.64%. Tech and AI stocks fell sharply, with the Nasdaq down 2.5%. WTI and Brent crude fell more than 3% on expectations of oversupply.
  • What to watch: Whether gold holds $3,855–3,870 and reclaims $3,920–3,930, along with U.S. retail sales and industrial production tonight and the Fed minutes Wednesday night.

Dollar index hits 103.52 as yields ease, while December Fed hike bets push gold to test $3,850

U.S. spot gold extended its decline by $27.90 (-0.72%) to around $3,855.50 per ounce after touching $3,832.20. Silver fell 3.64% to $46.86. The stronger dollar index, at 103.52, pressured precious metals even as safe-haven buying of Treasuries pushed the 10-year yield down to around 5.122% and the 2-year yield to 4.825%.

The November Empire State index fell to 7.8 from 25.5, below the 17.6 forecast. Price pressures and employment remained firm, in line with a 6.5% year-over-year rise in PPI. Futures priced in a 90% chance of a 25 bps Fed hike in December. Kevin Warsh gave no clear guidance on rates, leaving markets focused on tonight's retail sales and Wednesday's Fed minutes.

Tech and AI sell-off sends Nasdaq down 2.5% as investors cut risk and move into dollars

U.S. and European stocks closed sharply lower, led by technology and semiconductor shares. The Dow Jones fell 739 points (-1.4%) to 51,608.17, the S&P 500 declined 1.9% to 7,416.59, the Nasdaq dropped 2.5% to 24,509.76, and the Stoxx 600 slipped 0.28%. Nvidia and ASML came under pressure amid concerns over AI valuations and tighter U.S. chip export controls.

The key point for traders: A steep equity sell-off drove buyers into Treasuries and pulled yields lower, but gold failed to recover because investors sold precious metals alongside stocks to raise cash and hold dollars. Concerns about industrial demand put further pressure on silver. The moves suggest the dollar remains better at attracting liquidity during a sharp market correction.

Strait of Hormuz tensions persist, but crude drops more than 3% on fourth-quarter oversupply expectations

Tensions in the Strait of Hormuz and between the U.S. and Iran remain unresolved. Iran reported that more vessels were damaged by naval mines over the weekend, although the reports have not been fully independently verified. The U.S. continues to blockade Iranian ports, and no diplomatic deal has been reached. Maritime risk has therefore lent some support to demand for gold as a hedge.

Crude prices fell sharply, however. Brent dropped $3.40 (-3.6%) to close at $92.44 per barrel, and WTI fell $2.84 (-3.2%) to $85.72 per barrel. Middle Eastern oil exports recovered to near prewar levels, and the IEA expects a fourth-quarter supply glut. Cheaper energy could ease inflation, but the dollar and Fed policy continue to drive gold in the near term.

Risk-Free Demo Account
ASIC-regulated | 24х7 | T+0 | low spreads. Enjoy limit and stop loss for every trade!

bannerBg

Technical Analysis of Gold (XAU/USD)

On the 1-hour chart, gold remains in a short-term downtrend, with successive lower highs at $4,060, $3,995, $3,922 and $3,888. On Monday night it broke below support at $3,855–3,870 and swept liquidity near $3,832–3,833, toward the upper end of the $3,815–3,835 zone. It then rebounded toward $3,888 before consolidating near $3,855.57 this morning.

The 1-hour RSI (14) approached 30 as gold fell to $3,832 and has since recovered to around 44–45. It is tracking its yellow moving average and remains below 50. Selling pressure has eased somewhat, but buying is still too weak to confirm a reversal.

Today's key test is whether gold can hold above $3,855–3,870 and form a higher low above $3,832. It first needs to clear $3,892–3,903 and reclaim initial resistance at $3,920–3,930. If the rebound is rejected, it could prove to be a bull trap.

A sustained break above $3,920–3,930 would open the way to tests of $3,957–3,972 and $4,018–4,034, in that order. A 1-hour close below $3,855 could lead to tests of $3,815–3,835 and the psychological support zone at $3,780–3,800.

Today's Gold Price Outlook

Scenarios
  • Bull Case: If gold holds $3,855–3,870, forms a higher low above $3,832 and reclaims $3,920–3,930, it could recover toward $3,957–3,972 and $4,018–4,034.
  • Bear Case: A 1-hour close below support at $3,855–3,870, followed by further selling, would confirm a new leg lower toward $3,815–3,835 and $3,780–3,800.
  • Sideways Case: Gold consolidates between $3,855–3,870 and $3,920–3,930 as the market absorbs selling pressure and awaits tonight's U.S. retail sales and the Fed minutes.

Gold chart analysis illustration

Today's Trading Strategy

For short-term traders: Trade the range with discipline, watch how gold responds to support at $3,855–3,870 and resistance at $3,920–3,930, avoid chasing prices in the middle of the range, and always use a stop-loss.

  • Buy setup: Wait for a pullback to $3,855–3,870 or $3,815–3,835 and a clear reversal candle, or buy on momentum if gold holds above $3,930. Targets are $3,920–3,930 and $3,957–3,972, with a stop-loss below $3,830.
  • Sell setup: Look to sell if a bounce stalls at $3,892–3,903 or $3,920–3,930, or follow the move if gold breaks below $3,855. Targets are $3,835 and $3,815–3,835, with a stop-loss above $3,938.

For longer-term holders: A strong dollar and bets on a December Fed rate hike continue to cap near-term upside. Avoid chasing the price. Wait for a firm base or look to accumulate near $3,815–3,835 after the Fed minutes Wednesday night.

Daily Support and Resistance Levels

TypePrice Level
Support #1$3,855–3,870
Support #2$3,815–3,835
Support #3$3,780–3,800
Resistance #1$3,920–3,930
Resistance #2$3,957–3,972
Resistance #3$4,018–4,034

Today's Questions (FAQ)

Why didn't gold rebound even as U.S. tech stocks fell sharply and Treasury yields declined?

The tech sell-off drove investors into Treasuries, pushing the 10-year yield down to around 5.12%. But sharp volatility also triggered selling across asset classes as investors raised cash and held dollars. The dollar index rose to 103.52, weighing on gold in the near term.

How do the drop of more than 3% in crude oil and persistent Hormuz tensions affect gold?

Risks in the Strait of Hormuz lend some support to demand for gold as a hedge. Lower crude prices amid expectations of oversupply could ease medium-term inflation pressures, but the dollar and Fed policy still drive gold's near-term direction.

Read more

  • Bitcoin Plunges 13% in a Week as Market Retreats to $60,000 Level
  • Silver Price Forecast: XAG/USD hits yearly lows below $47.50 amid hawkish Fed sentiment
  • Note: If you want to share the article 《Gold Price Analysis Today | Forex Gold Analysis | XAU/USD Analysis - November 17, 2026》, make sure you retain the original link. For more information, please visit Insights or browse www.mitrade.com.

    The above content was completed with the assistance of AI and has been reviewed by an editor.


    goTop
    quote
    Related Articles
    placeholder
    Weekly Report: Gold's $4,000 reclaim and Brent's $100 break were right calls — the silver call was wrongLast week this report said gold's $4,000 reclaim was not the trend and that Brent's supply premium was over. Gold fell 4.7% to $3,884.69 and Brent fell 2.52% to $95.84, so both were right. The call that missed was silver: we read a gold-silver ratio of 78.7 as silver being cheap, and the ratio instead broke above 80 to 81.1 as silver fell 5.35%. This report grades the three calls, explains the miss, and sets this week's scorecard around 3,852 gold, 93.73 Brent and 6.00 copper.
    Author  Irene Q.
    Yesterday 02: 58
    Last week this report said gold's $4,000 reclaim was not the trend and that Brent's supply premium was over. Gold fell 4.7% to $3,884.69 and Brent fell 2.52% to $95.84, so both were right. The call that missed was silver: we read a gold-silver ratio of 78.7 as silver being cheap, and the ratio instead broke above 80 to 81.1 as silver fell 5.35%. This report grades the three calls, explains the miss, and sets this week's scorecard around 3,852 gold, 93.73 Brent and 6.00 copper.
    placeholder
    Gold Price Analysis Today | Forex Gold Analysis | XAU/USD Analysis - November 16, 2026Get the latest gold price analysis, forex gold insights, and XAU/USD analysis for November 16, 2026. Read on for the details.
    Author  Mitrade
    Yesterday 02: 45
    Get the latest gold price analysis, forex gold insights, and XAU/USD analysis for November 16, 2026. Read on for the details.
    placeholder
    Gold Price Forecast: Gold Tumbles Below $3,900 as Trump Says No Need for Iran Deal; Can October PPI Spur a Rebound? As of the Asian session on Friday (November 13), gold prices (XAUUSD) rebounded intraday following Thursday's sharp decline, trading near $3,910. Previously, gold tumbled 2.76% on Thursda
    Author  TradingKey
    Nov 13, Fri
    As of the Asian session on Friday (November 13), gold prices (XAUUSD) rebounded intraday following Thursday's sharp decline, trading near $3,910. Previously, gold tumbled 2.76% on Thursda
    placeholder
    Gold hit a one-year low while central banks bought 321 tonnes — the sellers were never the ones you thinkSpot gold closed at 3,876 on Thursday, down 2.8% and its lowest close in more than a year, with an intraday low near 3,852. The dollar is at a 19-month high of 103.21 and the 10-year yield is at 5.10%, so the price move is easy to explain. What is harder to explain is who sold: central banks bought 321 tonnes in Q3, the PBoC added for a 24th straight month, ETF holdings are near a record 4,256 tonnes, and roughly 95% of the futures selling came from non-reportable and sovereign-type accounts rather than hedge funds. This piece separates the two books that have to balance.
    Author  Irene Q.
    Nov 13, Fri
    Spot gold closed at 3,876 on Thursday, down 2.8% and its lowest close in more than a year, with an intraday low near 3,852. The dollar is at a 19-month high of 103.21 and the 10-year yield is at 5.10%, so the price move is easy to explain. What is harder to explain is who sold: central banks bought 321 tonnes in Q3, the PBoC added for a 24th straight month, ETF holdings are near a record 4,256 tonnes, and roughly 95% of the futures selling came from non-reportable and sovereign-type accounts rather than hedge funds. This piece separates the two books that have to balance.
    placeholder
    US October PPI Preview: Fed Rate Hike Expectations Rise, PPI May Be Key Variable; How Will US Stocks, Dollar, and Gold Move?On Friday (Nov. 13) Eastern Time, the U.S. will release the October Producer Price Index (PPI). Following the October CPI once again exceeding expectations, the market will look to the PP
    Author  TradingKey
    Nov 12, Thu
    On Friday (Nov. 13) Eastern Time, the U.S. will release the October Producer Price Index (PPI). Following the October CPI once again exceeding expectations, the market will look to the PP
    Live Quotes
    Name / SymbolChart% Change / Price
    XAUUSD
    XAUUSD
    0.00%0.00

    Gold Related Articles

    • 10 Best Day Trading Platforms for Beginners and Active Traders in 2026: A Practical Guide
    • What is Gold CFD? How to Trade Gold CFD With Mitrade Example
    • ​5 Best Paper Trading Platforms for 2026 (Free Demo Accounts for Beginners & Traders)
    • XAU/USD Gold Price Trend Analysis 2026: Will It Keep Rising?
    • Is Mitrade Right for You? A Complete Guide on How to Start Trading CFDs in 5 Steps
    • How and Where to Buy Gold in Australia? A Complete Guide for Beginners

    Click to view more