Bitcoin Plunges 13% in a Week as Market Retreats to $60,000 Level

Mitrade
coverImg
Source: DepositPhotos

TradingKey - Bitcoin plunged 13% over the past seven days as bullish defense lines crumbled in succession, officially kicking off the battle to defend the $60,000 mark.

On November 16, following a violent weekend deleveraging storm across the cryptocurrency market, prices saw a modest rebound in early trading today, with Bitcoin (BTC) recovering to the $64,400–$65,000 range. However, the Fear & Greed Index has plunged to 12 into extreme fear territory, as market bulls have fully retreated to defend the key psychological and volume support at the $60,000 round number.
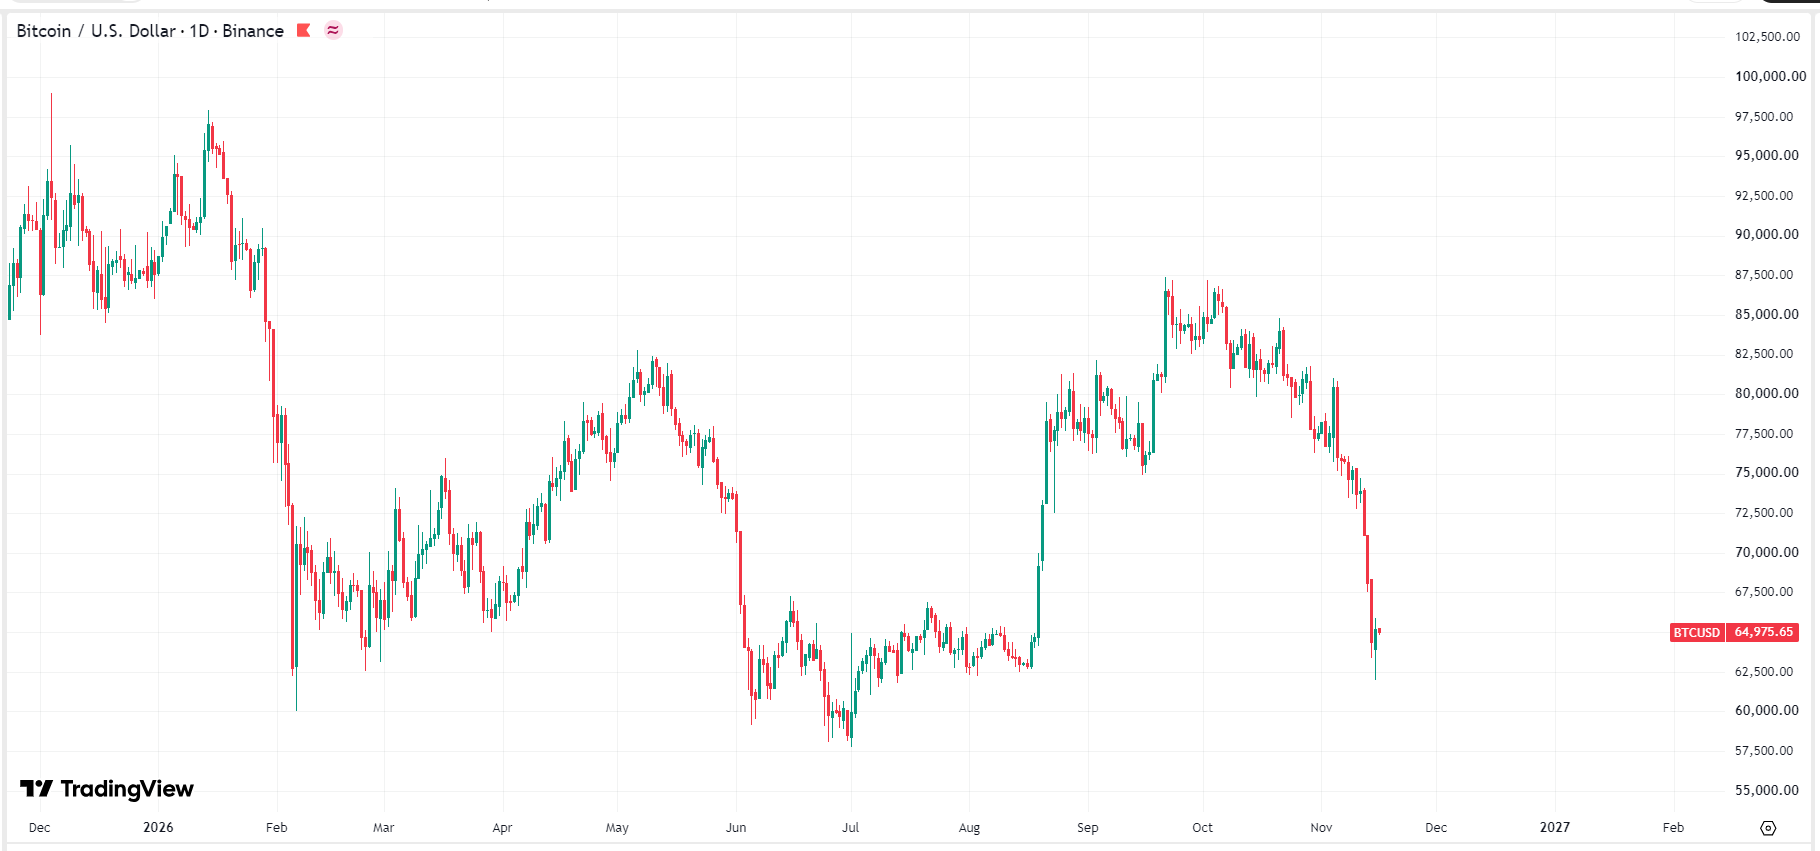
bitcoin-btc-price-9ea7d6eea72f4415895a05ef95e10f5fBitcoin price chart, Source: TradingView

Over the past seven days, BTC has tumbled by approximately 113%, breaking below key defense lines such as $70,000 and $65,000 in succession. It dropped as low as $62,086 intraday on Sunday, hitting a nearly four-month low since early July 2026 and down by more than 50% from its all-time high set in October 2025.

Last week, U.S. CPI and PPI releases pointed to resilient inflation alongside strong employment data, triggering a dramatic shift in market expectations regarding Federal Reserve monetary policy—with futures markets and interest rate options even beginning to price in the possibility that the Fed could resume rate hikes at its December meeting.

Against this backdrop, the 10-year U.S. Treasury yield remained elevated at 5.1%, while the U.S. Dollar Index (DXY) strengthened to 103. In an environment of sharply higher risk-free rates, global capital accelerated its retreat from high-risk, high-beta digital assets, with Bitcoin bearing the brunt.

In addition, traditional tech stocks and the semiconductor sector have experienced high-level volatility recently, with a steep plunge in Nvidia's share price in particular dampening risk appetite across retail markets in Asia, Europe, and the U.S. At the same time, market capital began earmarking liquidity for Anthropic's IPO, siphoning off funds from venture capital and high-risk assets and intensifying the liquidity squeeze within the crypto market. On-chain data also reveals that total stablecoin supply contracted by more than $10 billion in a month, reflecting a substantive decline in available purchasing power within the market.

As Bitcoin's bearish momentum continues to be unleashed, the line of defense has shifted downward to $60,000—not only the round-number psychological barrier most closely watched by global investors, but also a support level since July of this year. Furthermore, on-chain metrics show that the RSI has entered deeply oversold territory, while the holding structure of long-term holders of more than 155 days remains solid. As long as the $60,000 mark can be held this week, an oversold bounce fueled by short covering cannot be ruled out.

Read more

  • Gold Price Forecast: Gold Tumbles Below $3,900 as Trump Says No Need for Iran Deal; Can October PPI Spur a Rebound?
  • Today’s Market Recap: Nvidia Drops Over 4% After Jensen Huang Resigns, AMD and Broadcom Both Rise Over 5%
  • * The content presented above, whether from a third party or not, is considered as general advice only.  This article should not be construed as containing investment advice, investment recommendations, an offer of or solicitation for any transactions in financial instruments.

    goTop
    quote
    Related Articles
    placeholder
    Bitcoin lost its 200-day average — but the exit started three sessions before the CPIBitcoin fell 2.5% to about $73,400 on 11 November, an 11-week low, breaking its 200-day moving average near $73,100. The 24-hour liquidation tally reached $632 to $705 million, roughly 82% of it longs. But spot ETF outflows began three sessions earlier and USDT's market cap has shrunk $6.6 billion in 60 days — the leveraged length left before the inflation print did. A double top at 81,890 and 81,080 leaves a measured target of 69,366.
    Author  Suzie
    Nov 11, Wed
    Bitcoin fell 2.5% to about $73,400 on 11 November, an 11-week low, breaking its 200-day moving average near $73,100. The 24-hour liquidation tally reached $632 to $705 million, roughly 82% of it longs. But spot ETF outflows began three sessions earlier and USDT's market cap has shrunk $6.6 billion in 60 days — the leveraged length left before the inflation print did. A double top at 81,890 and 81,080 leaves a measured target of 69,366.
    placeholder
    Bitcoin ETFs sold $1.28 billion in a week — and BTC is still above 75,000US spot Bitcoin ETFs logged $1.28 billion of net outflows in the week to Nov 6, the largest since late June, with BlackRock's IBIT accounting for $1.21 billion. Yet BTC only fell from $80,405 to $74,940, a 6.8% move. The gap between the fund flow and the price is the story: leveraged longs were flushed, but spot holders did not follow the ETFs out — and $75,000 is the line that decides whether that reading holds.
    Author  Suzie
    Nov 09, Mon
    US spot Bitcoin ETFs logged $1.28 billion of net outflows in the week to Nov 6, the largest since late June, with BlackRock's IBIT accounting for $1.21 billion. Yet BTC only fell from $80,405 to $74,940, a 6.8% move. The gap between the fund flow and the price is the story: leveraged longs were flushed, but spot holders did not follow the ETFs out — and $75,000 is the line that decides whether that reading holds.
    placeholder
    Binance replaced 95% of a $6.3bn hole — Bitcoin is trading the plumbing, not the coinBinance resumed withdrawals on November 1 after a record $6.3bn theft. In the first 9.5 hours, users withdrew $4.64bn and deposited $1.01bn, a net outflow of $3.64bn, or 2.1% of assets. Bitcoin fell to 76,173 and is now 78,473. The market is pricing the exchange, not the supply.
    Author  Suzie
    Nov 02, Mon
    Binance resumed withdrawals on November 1 after a record $6.3bn theft. In the first 9.5 hours, users withdrew $4.64bn and deposited $1.01bn, a net outflow of $3.64bn, or 2.1% of assets. Bitcoin fell to 76,173 and is now 78,473. The market is pricing the exchange, not the supply.
    placeholder
    Bitcoin is back above $80,000 — but 75% of the bounce was shorts, not buyersBitcoin trades at $80,669, back above the $80,000 line after touching $79,145 on October 24. But 75.4% of the last 24 hours of futures liquidations were shorts, CME open interest fell 36,545 BTC in October, and spot ETFs lost $773.5 million on October 22-23. Price is up; positioning is down. Here is why the bounce is a squeeze, and the four things that would make it real.
    Author  Suzie
    Oct 28, Wed
    Bitcoin trades at $80,669, back above the $80,000 line after touching $79,145 on October 24. But 75.4% of the last 24 hours of futures liquidations were shorts, CME open interest fell 36,545 BTC in October, and spot ETFs lost $773.5 million on October 22-23. Price is up; positioning is down. Here is why the bounce is a squeeze, and the four things that would make it real.
    placeholder
    Bitcoin's double top at $88,000: why $78,000 is the line that decides the next moveBitcoin trades near $82,500 (+0.47%) after twice failing at the $88,000 area, forming a potential double top with a neckline at $78,000. A break below the neckline would project a measured target near $68,200; a close back above $88,000 would invalidate the pattern. Here are the structure, the levels and what would confirm either side.
    Author  Suzie
    Oct 19, Mon
    Bitcoin trades near $82,500 (+0.47%) after twice failing at the $88,000 area, forming a potential double top with a neckline at $78,000. A break below the neckline would project a measured target near $68,200; a close back above $88,000 would invalidate the pattern. Here are the structure, the levels and what would confirm either side.
    Live Quotes
    Name / SymbolChart% Change / Price
    BTCUSD
    BTCUSD
    0.00%0.00
    ETHUSD
    ETHUSD
    0.00%0.00

    Bitcoin Related Articles

    • Bitcoin Leverage And Margin Trading in 2026: The Ultimate Beginner's Guide
    • Gold vs Bitcoin 2026: Which Is the Better Investment?Best Hedge Asset Comparison
    • Best Strategies When BTC Price Drops: From Hedging to Accumulating
    • How to Day Trade Crypto? Simplest Day Trading Strategy Ever
    • Bitcoin Price Prediction 2026-2030: Long-Term Outlook Driven by Data & Macro Cycles
    • Bitcoin Mining Beginner Guide: What Is Bitcoin Mining and How to Mine Bitcoin?

    Click to view more