

Gold Price Forecast: Gold Holds Key $3,850 Support, US October Retail Sales May Drive Rebound Toward $4,000

Source Tradingkey

TradingKey - As of the Asian session on Tuesday (November 17), gold (XAUUSD) maintained a weak rebound intraday today after recent continuous declines to a nearly one-year low, edging up 0.2% during the session to trade near $3,865. Previously, as the US dollar continued to strengthen, US Treasury yields remained high, and market expectations for a December Fed rate hike further heated up, gold remained under short-term pressure, falling to as low as $3,832.70 on Monday, its lowest since October 2025. Notably, US October retail sales data is due to be released today, which could become a key factor influencing the short-term trajectory of gold prices.

US Retail Sales Expected to Slow: Can It Ease Fed Rate Hike Pressure?

The market currently expects U.S. retail sales to increase by 0.2% month-over-month in October, significantly lower than September's 0.8%; retail sales excluding autos are projected to rise 0.4%, down from the prior reading of 0.9%. September retail sales previously posted strong performance, but part of the growth stemmed from rising gasoline prices; core retail sales—excluding autos, gasoline, building materials, and food services—grew by just 0.1%. This suggests that although headline retail sales growth was relatively strong, underlying consumer spending momentum did not accelerate across the board. As energy price fluctuations and the high-base effect of prior consumption growth gradually take effect, the market expects retail sales growth to moderate in October.

For gold, the key to this retail sales report lies in whether U.S. consumer demand remains resilient and whether the data can shift expectations for a Federal Reserve rate hike in December. Previously released U.S. CPI and PPI data for October showed that inflation pressures remain elevated, and several Fed officials have recently signaled hawkish stances. According to the CME FedWatch Tool, the market currently sees a 95.5% probability of the Fed raising rates by 25 basis points in December and a 4.5% probability of a 50-basis-point hike. Consequently, the U.S. dollar hit a new high since April 2025, while Treasury yields remained elevated, raising the opportunity cost of holding non-yielding gold and serving as a major reason for the recent continuous decline in gold prices.

If today's retail sales print comes in below expectations, especially with weak core retail sales, it could indicate that U.S. consumption growth momentum is slowing, thereby dampening market expectations for further Fed monetary tightening. In that scenario, the U.S. dollar and Treasury yields could retreat, paving the way for gold to rebound from recent lows. Conversely, if retail sales significantly exceed expectations and spending growth is not primarily driven by higher prices, it could reinforce the view that the U.S. economy remains resilient, further bolstering the Fed's hawkish stance and likely keeping gold prices under pressure. In addition, investors need to monitor the minutes of the Fed's October meeting, scheduled for release on Wednesday, to assess policymakers' attitudes toward the future rate-hike path.

Gold Price Technical Analysis
gold-12d5c33ca42043e89d0960197e1162e5

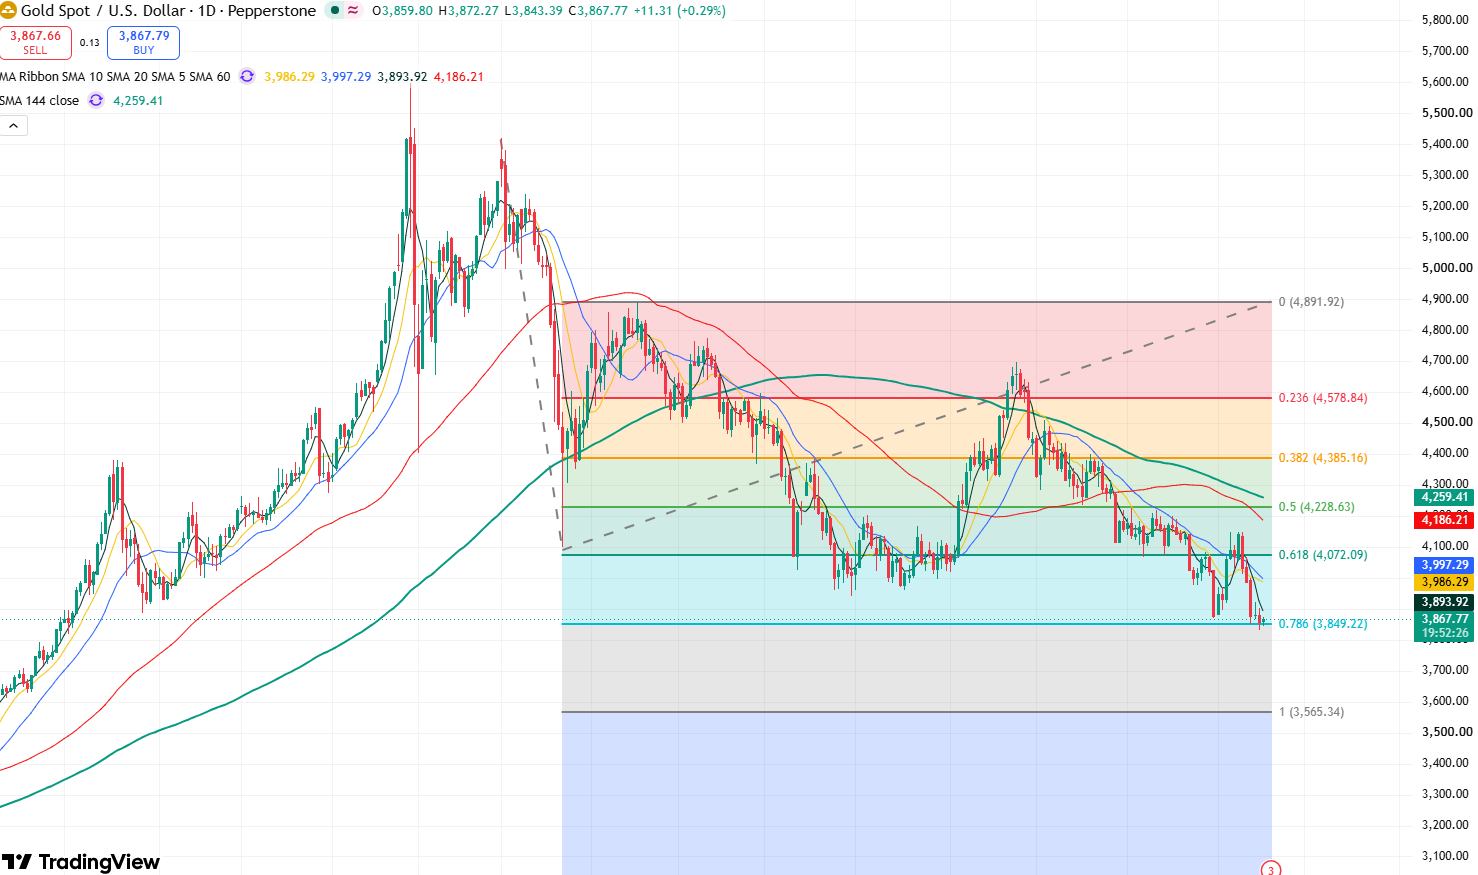
Gold price daily chart, Source: TradingView

From the daily chart, gold has continued its downward trend recently. After falling below the $4,000 and $3,900 marks last week, gold prices dropped further to $3,832.70 on Monday, hitting a new low in over a year and indicating that short-term downward pressure has not yet eased.

However, it is worth noting that gold closed at $3,856.46 on Monday, remaining firmly above $3,850. Meanwhile, this level corresponds to the 0.786 Fibonacci retracement level, indicating strong support and suggesting that gold prices could see a short-term rebound.

At present, the likelihood of a short-term rebound in gold prices outweighs that of a decline. If retail sales data released today falls short of expectations and pushes gold firmly back above $3,900, the next resistance level to watch is near $3,920, where the previous rebound stalled. If this level is breached, gold is expected to rebound further toward the $4,000 mark.

On the downside, the primary support level to watch is $3,850, followed by Monday's low of $3,832.70. If this level is lost, gold will test toward $3,800, or even experience a deeper pullback toward $3,550.

Disclaimer: For information purposes only. Past performance is not indicative of future results.
placeholder
Nvidia reports tomorrow with an interim CEO — $108 billion is the easy numberNvidia closed at 162.85 on Friday, down 12.75% on the week and 32% below its 6 October record, with market value down to $3.92 trillion. The Q3 bar is $108 billion ±2%, and consensus already sits at $108.7 ~ 108.8 billion, so the revenue line is not where the surprise lives. The number that decides the reaction is the 71 ~ 72% Q4 gross-margin trough, followed by a Q4 guide against a $124.9 billion consensus. This piece prices the print, marks the 158.39 line and lays out the three scenarios in a table.
Author  Irene Q.
Yesterday 02: 11
Nvidia closed at 162.85 on Friday, down 12.75% on the week and 32% below its 6 October record, with market value down to $3.92 trillion. The Q3 bar is $108 billion ±2%, and consensus already sits at $108.7 ~ 108.8 billion, so the revenue line is not where the surprise lives. The number that decides the reaction is the 71 ~ 72% Q4 gross-margin trough, followed by a Q4 guide against a $124.9 billion consensus. This piece prices the print, marks the 158.39 line and lays out the three scenarios in a table.
placeholder
Anthropic is six times oversubscribed at $1.4 trillion while Nvidia is down 32% — the AI trade has two pricesAnthropic lists on Nasdaq as ANT on Thursday at $70 ~ $78 a share, raising up to $64.4 billion at a target valuation near $1.4 trillion, and the book is reportedly six times covered. In the same six weeks, Nvidia has fallen 32% and the QQQ is 10.9% below its October peak. Private capital and public markets are marking the same AI complex at two very different prices. This piece separates the two books: what the S-1 shows, who is anchoring the $26 billion private placement, and what Thursday's debut would have to do to change the public tape.
Author  Irene Q.
Yesterday 02: 27
Anthropic lists on Nasdaq as ANT on Thursday at $70 ~ $78 a share, raising up to $64.4 billion at a target valuation near $1.4 trillion, and the book is reportedly six times covered. In the same six weeks, Nvidia has fallen 32% and the QQQ is 10.9% below its October peak. Private capital and public markets are marking the same AI complex at two very different prices. This piece separates the two books: what the S-1 shows, who is anchoring the $26 billion private placement, and what Thursday's debut would have to do to change the public tape.
placeholder
Weekly Report: The index rose 2.5% while Nvidia fell 12.7% — two equity divergences, one should closeThe S&P 500 rose 2.51% to 7,561.67 and the QQQ rose 3.63% to 679.89 last week, while Nvidia fell 12.75% to 162.85 — a sixth straight weekly loss and 32% below its October record. In the same five sessions, energy equities rose 5.42% while WTI fell 2.52%. Both pairs normally move together (60-day correlations of +0.64 and +0.58). This report ranks which divergence closes first, with the trigger for each.
Author  Irene Q.
Yesterday 02: 35
The S&P 500 rose 2.51% to 7,561.67 and the QQQ rose 3.63% to 679.89 last week, while Nvidia fell 12.75% to 162.85 — a sixth straight weekly loss and 32% below its October record. In the same five sessions, energy equities rose 5.42% while WTI fell 2.52%. Both pairs normally move together (60-day correlations of +0.64 and +0.58). This report ranks which divergence closes first, with the trigger for each.
placeholder
Gold Price Analysis Today | Forex Gold Analysis | XAU/USD Analysis - November 16, 2026Get the latest gold price analysis, forex gold insights, and XAU/USD analysis for November 16, 2026. Read on for the details.
Author  Mitrade
Yesterday 02: 45
Get the latest gold price analysis, forex gold insights, and XAU/USD analysis for November 16, 2026. Read on for the details.
placeholder
Weekly Report: DXY 103.41, 10-year 5.15%, AUD carry 3bp — three FX regimes flipped in one weekThe dollar index rose 1.09% to 103.41, a 19-month high, while the US 10-year closed at 5.154% and the Australia-US two-year spread collapsed to about 3 basis points from 36. EURUSD fell 1.59% to 1.1024, USDJPY rose 1.51% to 159.78 and AUDUSD fell 1.79% to 0.6764, a 10-month low. Three FX regimes — the broad dollar, the US rate level and the Australian carry premium — flipped in the same week. This report marks the thresholds, ranks which one can flip back first, and lists the week's calendar.
Author  Irene Q.
Yesterday 03: 26
The dollar index rose 1.09% to 103.41, a 19-month high, while the US 10-year closed at 5.154% and the Australia-US two-year spread collapsed to about 3 basis points from 36. EURUSD fell 1.59% to 1.1024, USDJPY rose 1.51% to 159.78 and AUDUSD fell 1.79% to 0.6764, a 10-month low. Three FX regimes — the broad dollar, the US rate level and the Australian carry premium — flipped in the same week. This report marks the thresholds, ranks which one can flip back first, and lists the week's calendar.
goTop
quote