

Gold Price Forecast: Gold Tumbles Below $3,900 as Trump Says No Need for Iran Deal; Can October PPI Spur a Rebound?


Mitrade
coverImg
Source: DepositPhotos

TradingKey - As of the Asian session on Friday (November 13), gold prices (XAUUSD) rebounded intraday following Thursday's sharp decline, trading near $3,910. Previously, gold tumbled 2.76% on Thursday to close at $3,877.41, confirming a break below the $3,900 mark and dropping to a low of $3,852.27, marking a near-one-year low. The decline in gold was mainly driven by renewed tensions in the Middle East pushing up international oil prices, coupled with persistent U.S. inflation pressures, keeping short-term gold prices under sustained pressure.

October PPI Key to Gold Trend as US-Iran Talk Prospects Dim

The situation in the Middle East has shifted once again recently. U.S. President Donald Trump said on Thursday that the U.S. no longer needs to reach a deal with Iran, dampening market expectations for a diplomatic resolution to the conflict. Meanwhile, Yemen's Houthi rebels claimed attacks on Saudi Arabia's East-West pipeline pumping stations and other energy facilities, while shipping security risks in the Strait of Hormuz persisted. Reignited concerns over Middle East crude supply disruptions fueled a sharp rebound in international oil prices. On Thursday, Brent crude (UKOIL) rose 3.78% to settle at $95.94, while WTI crude (USOIL) gained 2.64% to settle at $88.69.

Rising oil prices increase the risk that energy costs will further push up U.S. inflation, thereby reinforcing market expectations that the Federal Reserve will keep interest rates elevated. Previously released data showed that U.S. October CPI rose 0.4% month-over-month, topping expectations of 0.3%, while core CPI also came in above market forecasts, indicating that inflationary pressures have not yet meaningfully abated. A renewed climb in energy prices could make it harder for inflation to cool moving forward, keeping the U.S. dollar and Treasury yields strong. For non-yielding gold, higher bond yields translate into a greater opportunity cost of holding the metal, which has been a primary reason for the recent persistent decline in gold prices.

Looking ahead, the market will focus closely on today's release of the U.S. October PPI data. The market currently expects headline PPI to rise 0.4% month-over-month, down from 1.3% in September, while core PPI is forecast to increase 0.3% month-over-month. If the actual reading beats expectations—particularly if core PPI continues to show strength—markets may further raise expectations for a December rate hike by the Federal Reserve, leaving gold under continued pressure. Conversely, if PPI comes in below expectations, signaling that wholesale price pressures have eased, the U.S. dollar and Treasury yields could retreat, creating conditions for a technical rebound in gold prices.

Gold Price Technical Analysis
gold-97ac9542c06c4dc2bca2c6bd9b1b00d8

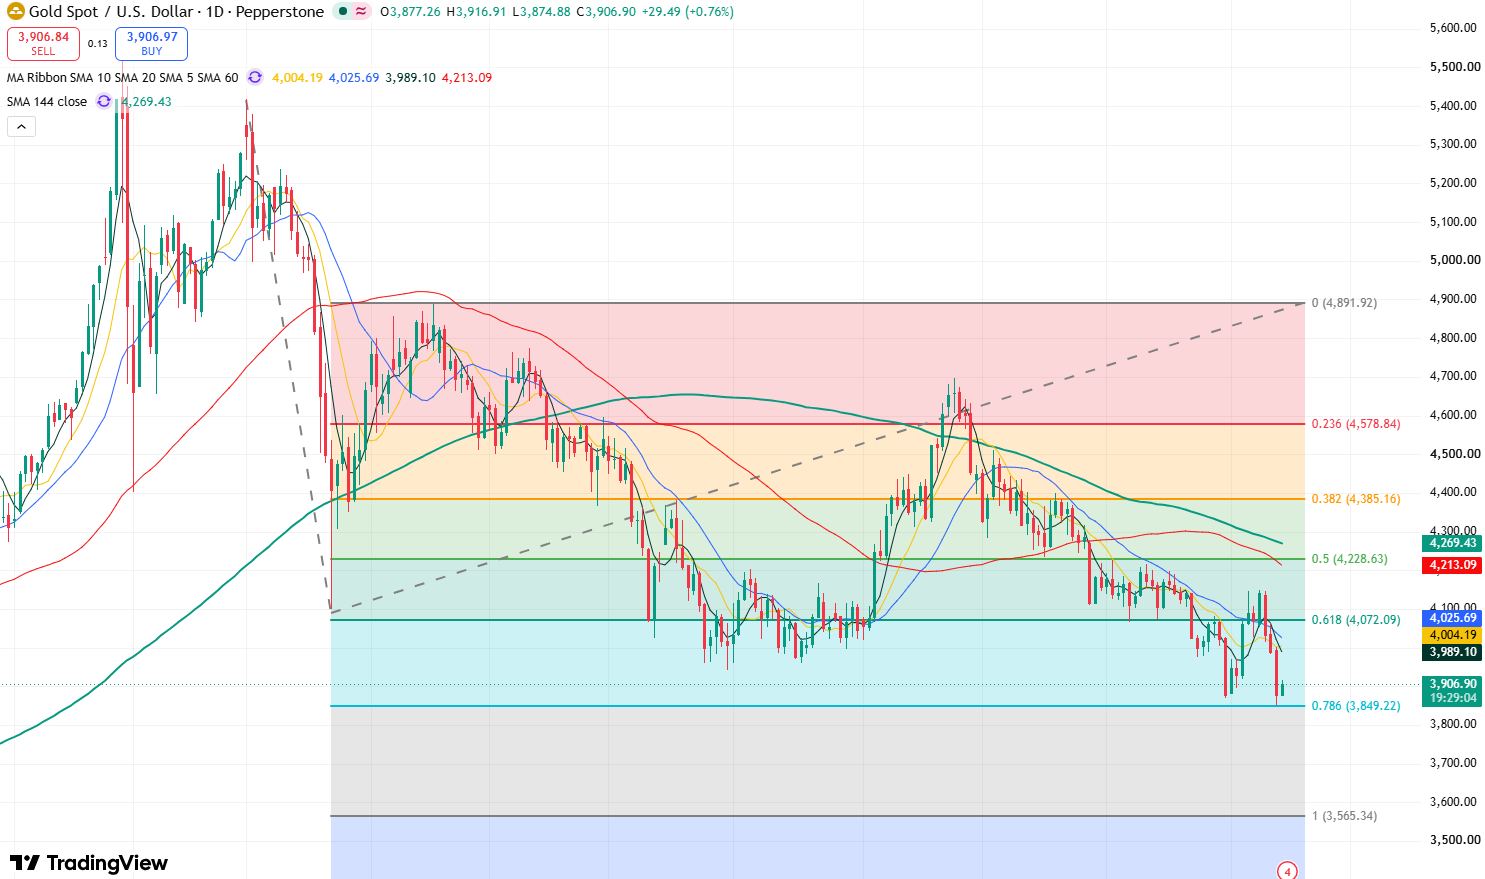
Gold price daily chart, Source: TradingView

From gold's daily chart, the recent downtrend has accelerated noticeably. After rebounding to near $4,148 on November 9, gold prices retreated continuously, successively breaking below the $4,100, $4,000, and $3,900 marks. On Thursday, prices accelerated further downward to around $3,852, hitting a near one-year low, and the short-term downward structure has yet to show clear signs of a reversal.

Currently, gold hit a low near $3,850 on Thursday, which sits near the 0.786 Fibonacci retracement level. Prices could find short-term support here for a potential rebound, and gold's bounce in early trading today indicates that this level indeed offers some support. However, as gold broke below its October 30 low of $3,870.10, downside space has opened up, and bears still maintain the upper hand in the short term.

On the downside, initial support for gold lies near $3,850. If this level fails to hold, prices could retreat toward the $3,800 mark; if that level is breached, it will open up downside toward around $3,550.

On the upside, if today's PPI release comes in below expectations and helps gold regain its footing above $3,930, the next resistance will target $3,950-$3,970. A further breakout would make the round-number $4,000 mark a more critical technical resistance. Until gold firmly reclaims $4,000, the current rebound may remain constrained by the prior downtrend.

Read more

  • US October PPI Preview: Fed Rate Hike Expectations Rise, PPI May Be Key Variable; How Will US Stocks, Dollar, and Gold Move?
  • Gold Extends Slide Below $4,000 as Rising US Inflation, Fed December Hike Bets Pressure Prices
  • * The content presented above, whether from a third party or not, is considered as general advice only.  This article should not be construed as containing investment advice, investment recommendations, an offer of or solicitation for any transactions in financial instruments.

    goTop
    quote
    Related Articles
    placeholder
    Gold hit a one-year low while central banks bought 321 tonnes — the sellers were never the ones you thinkSpot gold closed at 3,876 on Thursday, down 2.8% and its lowest close in more than a year, with an intraday low near 3,852. The dollar is at a 19-month high of 103.21 and the 10-year yield is at 5.10%, so the price move is easy to explain. What is harder to explain is who sold: central banks bought 321 tonnes in Q3, the PBoC added for a 24th straight month, ETF holdings are near a record 4,256 tonnes, and roughly 95% of the futures selling came from non-reportable and sovereign-type accounts rather than hedge funds. This piece separates the two books that have to balance.
    Author  Irene Q.
    4 hours ago
    Spot gold closed at 3,876 on Thursday, down 2.8% and its lowest close in more than a year, with an intraday low near 3,852. The dollar is at a 19-month high of 103.21 and the 10-year yield is at 5.10%, so the price move is easy to explain. What is harder to explain is who sold: central banks bought 321 tonnes in Q3, the PBoC added for a 24th straight month, ETF holdings are near a record 4,256 tonnes, and roughly 95% of the futures selling came from non-reportable and sovereign-type accounts rather than hedge funds. This piece separates the two books that have to balance.
    placeholder
    US October PPI Preview: Fed Rate Hike Expectations Rise, PPI May Be Key Variable; How Will US Stocks, Dollar, and Gold Move?On Friday (Nov. 13) Eastern Time, the U.S. will release the October Producer Price Index (PPI). Following the October CPI once again exceeding expectations, the market will look to the PP
    Author  TradingKey
    22 hours ago
    On Friday (Nov. 13) Eastern Time, the U.S. will release the October Producer Price Index (PPI). Following the October CPI once again exceeding expectations, the market will look to the PP
    placeholder
    Gold closed below $4,000 again — the ETF crowd and central banks stayed, the momentum money leftSpot gold is trading near $3,999, its third consecutive lower daily low, after a 5.00% 10-year yield and a 102.85 dollar index raised the odds of a December hike to 87%. But the selling is not coming from the strategic holders: managed-money net longs fell to 324 tonnes, a 21-week low, and Goldman Sachs attributes roughly 95% of five weeks of selling to non-reportable positions. ETFs still hold a record 4,256 tonnes and central banks bought 321 tonnes in Q3. The table below sets the triggers, directions and levels.
    Author  Irene Q.
    Yesterday 03: 20
    Spot gold is trading near $3,999, its third consecutive lower daily low, after a 5.00% 10-year yield and a 102.85 dollar index raised the odds of a December hike to 87%. But the selling is not coming from the strategic holders: managed-money net longs fell to 324 tonnes, a 21-week low, and Goldman Sachs attributes roughly 95% of five weeks of selling to non-reportable positions. ETFs still hold a record 4,256 tonnes and central banks bought 321 tonnes in Q3. The table below sets the triggers, directions and levels.
    placeholder
    Gold Extends Slide Below $4,000 as Rising US Inflation, Fed December Hike Bets Pressure Prices On November 12, gold prices (XAUUSD) extended their recent losses, falling further below $4,000 in early Asian trading to hit an intraday low near $3,968, marking a third consecutive day
    Author  TradingKey
    Yesterday 02: 00
    On November 12, gold prices (XAUUSD) extended their recent losses, falling further below $4,000 in early Asian trading to hit an intraday low near $3,968, marking a third consecutive day
    placeholder
    Gold Tumbles Toward $4,000 as Hotter-Than-Expected CPI Boosts Fed Rate-Hike Bets, Bulls Eye $3,975 SupportAs of the Asian session on Wednesday (November 11), gold prices (XAUUSD) rebounded slightly after a sharp decline in the previous session, last trading near $4,040, up about 0.3% on the d
    Author  TradingKey
    Nov 11, Wed
    As of the Asian session on Wednesday (November 11), gold prices (XAUUSD) rebounded slightly after a sharp decline in the previous session, last trading near $4,040, up about 0.3% on the d
    Live Quotes
    Name / SymbolChart% Change / Price
    XAUUSD
    XAUUSD
    0.00%0.00
    XAGUSD
    XAGUSD
    0.00%0.00
    USDOLLAR-F
    USDOLLAR-F
    0.00%0.00

    Gold Related Articles

    • 10 Best Day Trading Platforms for Beginners and Active Traders in 2026: A Practical Guide
    • What is Gold CFD? How to Trade Gold CFD With Mitrade Example
    • ​5 Best Paper Trading Platforms for 2026 (Free Demo Accounts for Beginners & Traders)
    • XAU/USD Gold Price Trend Analysis 2026: Will It Keep Rising?
    • Is Mitrade Right for You? A Complete Guide on How to Start Trading CFDs in 5 Steps
    • How and Where to Buy Gold in Australia? A Complete Guide for Beginners

    Click to view more