


Bitcoin vs Gold Outlook: BTC dips, XAU holds support despite bearish pressure
- Bitcoin slips near $64,000, down 17% in November as selling pressure deepens in the broader crypto market.
- Bitcoin ETFs recorded over $1 billion in outflows last week, signaling subdued institutional interest.
- Gold's technical outlook remains notably weak amid a persistent tug-of-war between the bulls and the bears.
Bitcoin (BTC) remains largely under bear control on Monday, trading near $64,000. The Crypto King’s attempts to regain ground have been met with short-term selling, suggesting persistent risk-off sentiment and a lack of conviction from investors who have continued to endure battering.
“Bitcoin fell to about $62,000 on Sunday before recovering above $64,000, down 14.2% on the week. Liquidations reached $2.02 billion over the weekend, $1.68 billion of it longs,” QCP Capital analysts wrote in a recent report.
Gold (XAU/USD), meanwhile, trades slightly stable at $3,868, signaling a subtle attempt by the bulls to take back control. However, bearish bias appears strong, backed by a weakening technical structure.
Technical analysis: Bitcoin sell-off looks far from over
Bitcoin trades at $64,391, extending its slide well below the main Exponential Moving Averages (EMAs) and keeping the near‑term bias firmly bearish. Price holds under a dense topside cap formed first by the SuperTrend line around $72,754, then by the 200‑day, 100‑day, and 50‑day moving averages clustered between roughly $75,950 and $76,673, which together suggest any recovery would face layered supply.
Momentum conditions reinforce this negative tone, with the Relative Strength Index (RSI) at 23, deep in oversold territory and the Moving Average Convergence Divergence (MACD), hinting that downside pressure remains dominant despite the risk of short‑covering bounces.
Initial resistance appears at the SuperTrend barrier near $72,754, where the first meaningful test of selling interest could emerge if the pair attempts a rebound. Above that, the 200-day EMA at $75,951 is followed by the 100-day EMA at $76,456 and the 50-day EMA at $76,673.44, forming a broader supply zone that would likely cap the advance unless buyers regain sustained control.
With no clear structural support levels defined on the daily chart, traders will likely look for price action signals around psychological handles and recent lows, while respecting that the dominant trend and momentum configuration still favors selling rallies into the noted resistance cluster.
Gold technical analysis: XAU recovery remains elusive
Gold trades at $3,869, extending its retreat beneath a dense band of medium and long-term resistance that keeps the near‑term bias bearish. Spot gold now sits below the 50-day, 100-day and 200‑day Moving Average Exponential (EMA) at $4,112, $4,203 and $4,242, respectively, while the SuperTrend indicator at $4,136 also caps the topside.
Momentum is weak, with the RSI hovering near 37 and the MACD in negative territory, suggesting sellers retain control and any rebounds are likely corrective.
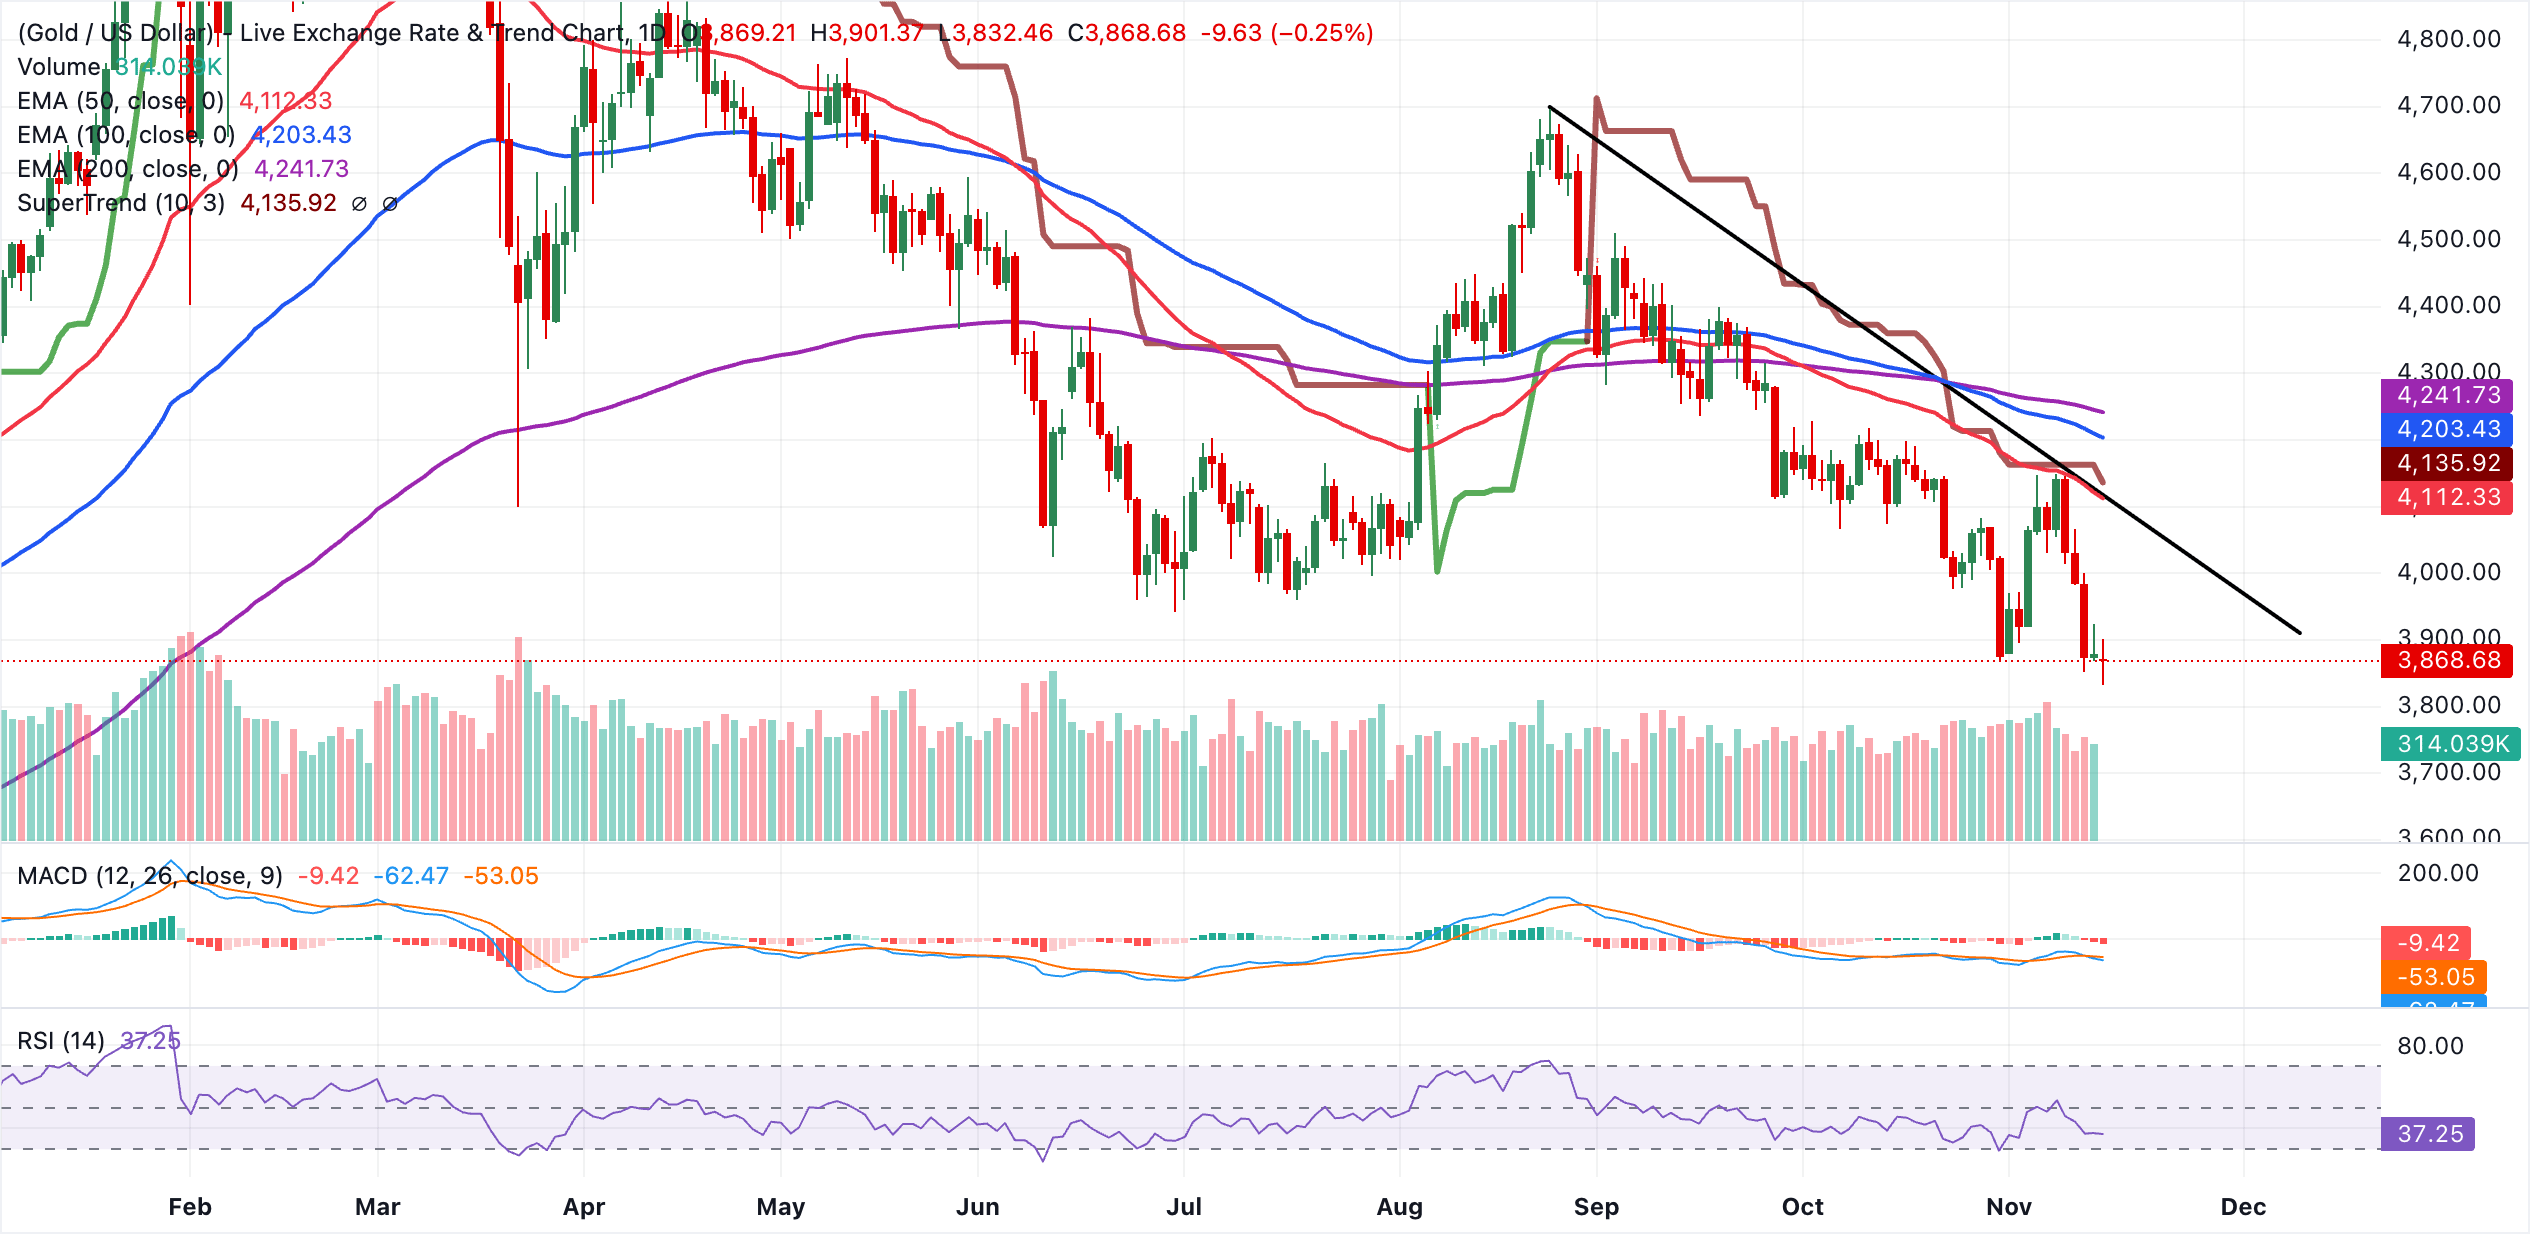
Initial resistance appears at the descending trendline break level near $4,065, followed by the 50‑day EMA at $4,112 and the SuperTrend signal at $4,136. Higher up, the 100‑day EMA at $4,203 and the 200‑day EMA at $4,242 comprise a broader structural barrier that would need to be reclaimed to alleviate the current downside bias.
On the downside, the latest close around $3,869 marks the immediate floor, and the lack of nearby mapped support suggests that fresh selling could quickly push XAU/USD into new lower territory until a clearer base forms.
(The technical analysis of this story was written with the help of an AI tool. Know more.)
Bitcoin, altcoins, stablecoins FAQs
Bitcoin is the largest cryptocurrency by market capitalization, a virtual currency designed to serve as money. This form of payment cannot be controlled by any one person, group, or entity, which eliminates the need for third-party participation during financial transactions.
Altcoins are any cryptocurrency apart from Bitcoin, but some also regard Ethereum as a non-altcoin because it is from these two cryptocurrencies that forking happens. If this is true, then Litecoin is the first altcoin, forked from the Bitcoin protocol and, therefore, an “improved” version of it.
Stablecoins are cryptocurrencies designed to have a stable price, with their value backed by a reserve of the asset it represents. To achieve this, the value of any one stablecoin is pegged to a commodity or financial instrument, such as the US Dollar (USD), with its supply regulated by an algorithm or demand. The main goal of stablecoins is to provide an on/off-ramp for investors willing to trade and invest in cryptocurrencies. Stablecoins also allow investors to store value since cryptocurrencies, in general, are subject to volatility.
Bitcoin dominance is the ratio of Bitcoin's market capitalization to the total market capitalization of all cryptocurrencies combined. It provides a clear picture of Bitcoin’s interest among investors. A high BTC dominance typically happens before and during a bull run, in which investors resort to investing in relatively stable and high market capitalization cryptocurrency like Bitcoin. A drop in BTC dominance usually means that investors are moving their capital and/or profits to altcoins in a quest for higher returns, which usually triggers an explosion of altcoin rallies.
Recommended Articles


