


Gold Price Analysis Today | Forex Gold Analysis | XAU/USD Analysis - November 16, 2026


Today's Gold Price
Gold price chart for today
*0% Commission and Low Spreads 0️⃣
*$50,000 in Free Virtual Funds 💰
*$100 New Customer Bonus 🎁
Gold (XAU/USD) traded near $3,887.86 this morning (November 16, 2026) after ending the week below $3,900. Annual U.S. producer price inflation rose to 6.5%, pushing the 10-year Treasury yield close to 5.15% and strengthening the dollar. Markets priced in a 100% chance of a December Fed rate hike. Today's focus is whether gold can hold $3,855–3,870, form a higher low and potentially test resistance at $3,920–3,930.
Today's Key Points
Key Points |
|
|
|
Annual PPI inflation hits 6.5%, pushing yields near 5.15% and reinforcing bets on a December Fed hike
The U.S. Labor Department reported that October PPI rose 0.3% month over month, below the 0.4% estimate. Annual growth accelerated to 6.5%, the highest since November 2022. Goods prices rose 0.5%, services prices rose 0.2%, and the core index increased 0.5%, pointing to persistent cost pressures following the CPI figures and a strong labor market.
Persistent inflation pushed the 10-year Treasury yield close to 5.15% and strengthened the dollar. Futures markets priced an 89% chance of a 25 bps Fed hike on December 8–9 and an 11% chance of a 50 bps move. Gold came under pressure before buying helped it end the week near $3,883.40 (+0.18%). Silver fell 2.63% to $48.63.
Oil glut forecasts outweigh Hormuz tensions as Brent and WTI fall for a 2nd straight week
Tensions in the Strait of Hormuz remain unresolved. The U.S. maintained its naval blockade of Iran while signaling it was in no hurry to take military action. President Trump said a diplomatic deal with Tehran was no longer necessary, while the Houthis continued to attack Saudi energy infrastructure and threaten oil tankers.
Oil ended the week lower for a 2nd straight week. Brent held near $95.84 and WTI fell 0.2% to $88.56 after the IEA forecast an oversupply in the 4th quarter and U.S. crude inventories rose unexpectedly. Geopolitical risk supported safe-haven demand for gold, while energy costs continued to favor a tight Fed policy.
U.S. tech shares weaken after Nvidia CEO resigns, with retail sales and Fed minutes in focus this week
U.S. stocks ended mixed on Friday despite slower monthly PPI growth. Selling in chip and AI stocks dragged the Nasdaq down 0.9% to 25,136.27 and the S&P 500 down 0.4% to 7,561.67. The Dow Jones rose 0.1% to close at 52,347.55. Nvidia shares came under pressure following CEO Jensen Huang's resignation.
This week, markets are watching October U.S. retail sales on Tuesday and Fed minutes on Wednesday. Continued strength in spending or hawkish minutes could lift yields and weigh on gold. Weaker retail sales could ease Treasury yields and allow gold to rebound.



Technical Analysis of Gold (XAU/USD)
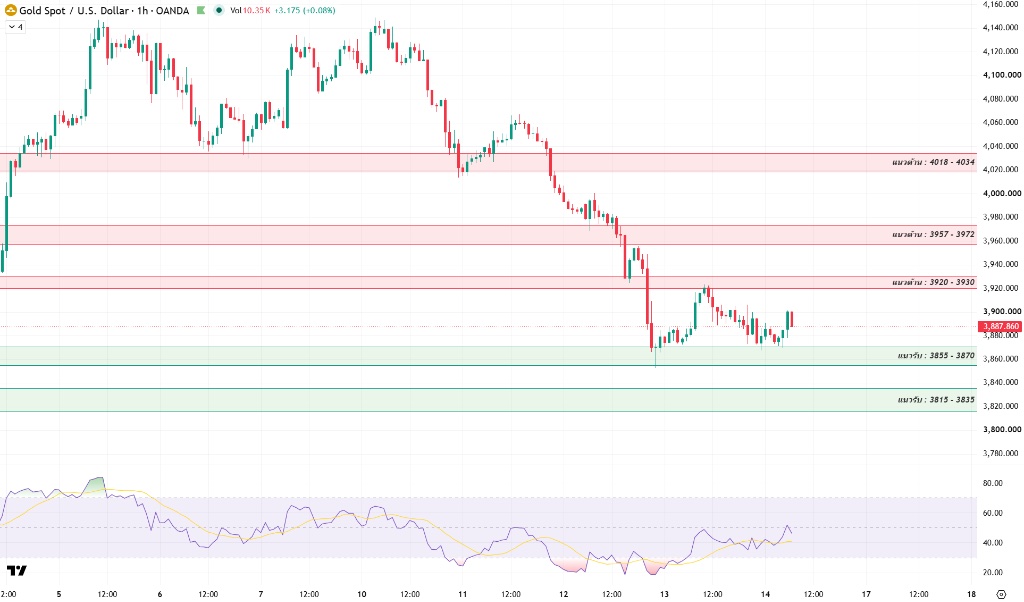
On the 1-hour chart, gold dropped from a weekly high near $4,148 to an interim low around $3,855, within its initial support zone of $3,855–3,870. Buying absorbed selling around that level and lifted gold to test $3,920–3,930. It then formed a base near $3,870–3,875 and was last holding at $3,887.86.
The 1-hour RSI (14) fell below 25 into oversold territory, then recovered in stages to near 46–48, above its yellow moving average. Selling pressure has eased, but RSI remains below 50, so gold is still forming a base and awaiting confirmation of a reversal.
The key test today is whether gold can hold above $3,855–3,870 and form a higher low. A sustained reclaim of initial resistance at $3,920–3,930 would confirm a near-term recovery. A rejected rebound could turn into a bull trap.
A sustained break above $3,920–3,930 would open the way to resistance at $3,957–3,972 and then the major resistance zone at $4,018–4,034. A 1-hour close below $3,855 would expose the next support at $3,815–3,835 and the psychological base at $3,780–3,800.
Today's Gold Price Outlook
Possible Scenarios |
|
|
|
Today's Trading Strategy
Short-term traders: Trade the range with discipline. Watch how gold reacts to support at $3,855–3,870 and resistance at $3,920–3,930. Avoid chasing prices in the middle of the range and always use a stop-loss.
- Buy: Wait for a pullback to $3,855–3,870 and a clear reversal candle, or buy on a sustained break above $3,930. The source lists take-profit targets at $3,920–3,930 and $3,957–3,972, with a stop-loss below $3,845.
- Sell: Wait for a rebound to be rejected at $3,920–3,930 or $3,957–3,972, or sell on a break below $3,855. The source lists targets at $3,870 and $3,815–3,835, with a stop-loss above $3,940.
Longer-term traders: Treasury yields above 5.1% are still limiting near-term upside. The suggested approach is to avoid chasing gains and wait for a firm base above $3,855, or assess potential accumulation near $3,815–3,835 after the Fed minutes.
Daily Support and Resistance Levels
Type | Price Level |
Support #1 | $3,855–3,870 |
Support #2 | $3,815–3,835 |
Support #3 | $3,780–3,800 |
Resistance #1 | $3,920–3,930 |
Resistance #2 | $3,957–3,972 |
Resistance #3 | $4,018–4,034 |
Today's Questions (FAQ)
Why did weaker-than-expected monthly PPI fail to spark a strong gold rebound?
October PPI rose 0.3%, below the 0.4% estimate, but annual inflation accelerated to 6.5% and the core index still rose 0.5%, pointing to persistent cost pressures. The 10-year Treasury yield approached 5.15%, and markets priced in a December Fed hike, limiting gold's recovery.
How are Strait of Hormuz tensions and oil prices affecting gold?
The U.S.–Iran conflict and attacks on shipping have supported safe-haven demand for gold. Brent and WTI have nevertheless fallen for 2 straight weeks amid the IEA's oversupply forecast, easing energy concerns and shifting the market's focus back to Treasury yields and Fed policy.
Read more
The above content was completed with the assistance of AI and has been reviewed by an editor.


