


United States Dollar Index retreats from 19-month high of 103.70, outlook remains bullish
- The US Dollar Index retreats to near 103.53 from its 19-month high of 103.70.
- Several Fed policymakers have warned of more interest rate hikes to contain upside inflation risks.
- MUFG says that markets are pricing three consecutive Fed interest rate hikes.
The US Dollar (USD) witnesses some correction after extending its rally in the Asian trade on Tuesday. As of writing, the US Dollar Index (DXY), which gauges the Greenback’s value against six major currencies, trades marginally lower to near 103.53 after retreating from its 19-month high of 103.70.
The Greenback has outperformed its currency peers in the past few weeks as financial markets are confident of a prolonged Federal Reserve (Fed) monetary tightening cycle due to persistent inflationary pressures.
Also, latest remarks from several Fed officials have signaled that they are highly concerned about high inflationary pressures.
Hammack flags broadening inflation pressures, supports smaller rate hikes
Fed’s Hammack delivered a moderately hawkish message on Monday, with a FXS Speechtracker score of 7.1/10, slightly softer relative to the historical average of 7.6/10 but still clearly focused on inflation risks. The emphasis on inflation “going in the wrong direction,” broadening price pressures, and businesses more willing to pass on price increases underscores concern that underlying inflation dynamics remain problematic, even as Hammack reiterates a preference for steady, smaller rate hike increments to allow the economy to adjust. The comment that financial conditions are “still not restraining the economy” and that the economy can handle more restriction reinforces a bias toward further tightening while keeping the 2% inflation goal firmly in place.
The FXS Fed Sentiment Index was unchanged, moving 0.00 points to a level of 147.36, signaling that the speech left the overall hawkish stance intact despite the slightly lower FXS Speechtracker score. With the FXS Fed Sentiment Index firmly above 100, the speech confirms that Fed communication remains in hawkish territory, consistent with ongoing concern about inflation and the need for higher market borrowing costs to restrain the economy.
Over the weekend, Kansas City Fed President Jeffrey Schmid also said, “Inflation is running too hot,” and the central bank “has some work to do on inflation”.
Schmid flags stubborn inflation, reinforcing hawkish Fed bias
Fed’s Schmid delivered a distinctly hawkish message, with a 7/10 FXS Speechtracker score edging above the 6.9/10 historical average and underscoring rising concern over persistent price pressures. By stressing that containing inflation has “only gotten harder,” that inflation is “uncomfortably above” the 2% target and would still be near 3% excluding energy, Schmid signaled that the Fed “has some work to do on inflation” even as the labor market is described as largely in balance and not a primary driver of current price dynamics. The emphasis on demand management, the rejection of targeting specific prices such as AI-related tech goods, and the assertion that it is not the Fed’s role to affect any single good or service collectively reinforce a broad-based, policy-driven approach to cooling inflation that is supportive of the Dollar.
The FXS Fed Sentiment Index rose by 1.00 points to 148.44, firmly in hawkish territory and consistent with the slightly above-baseline tone captured by the FXS Speechtracker score. This incremental move higher signals that, despite no explicit call for immediate tightening, market participants are likely to interpret Schmid’s remarks as keeping the Fed’s reaction function skewed toward further restraint, a backdrop that tends to underpin the Dollar against the Euro and Yen.
Analysts at MUFG/BTMU highlight that the sharp hawkish repricing of Fed policy has filtered directly into the US rates market, which is now "assigning a higher probability to three consecutive hikes in December, January and March, which would lift the effective Fed funds rate towards 4.6%."
US Dollar Index Technical Analysis
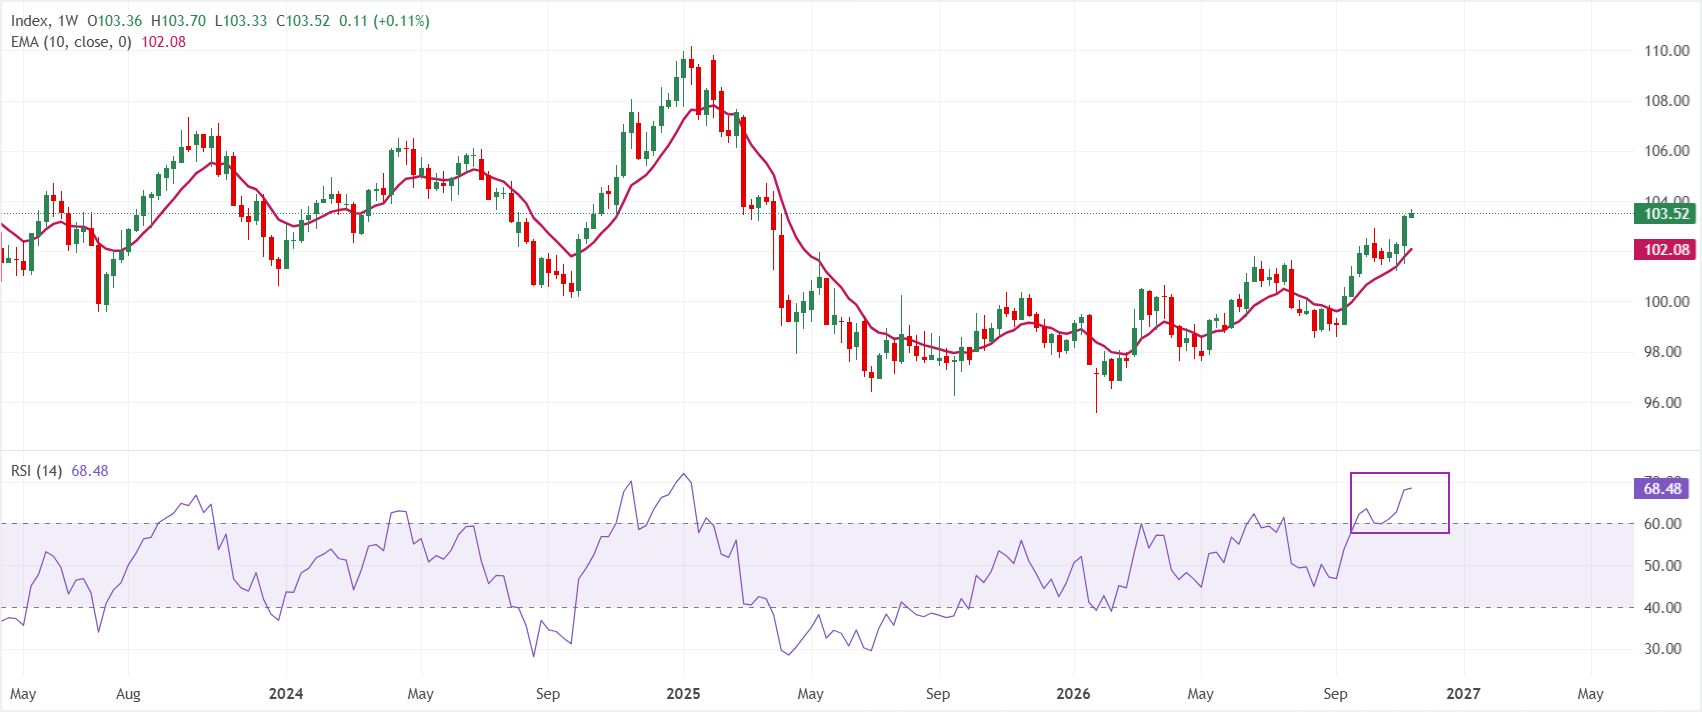
In the weekly chart, Dollar Index Spot trades at 103.52. The index holds above the 10-week exponential moving average (EMA) at 102.08, keeping the near-term structure bullish as price grinds higher away from trend support. The Relative Strength Index (RSI) at 68.46 sits just below overbought territory, suggesting firm upside momentum with only the early signs of stretched conditions.
On the downside, initial support is seen at the 10-week EMA at 102.08, where any corrective pullback would be expected to stabilize as long as buyers defend this dynamic floor. Looking up, the 104.00 level would be the key hurdle for the index.
Fed FAQs
Monetary policy in the US is shaped by the Federal Reserve (Fed). The Fed has two mandates: to achieve price stability and foster full employment. Its primary tool to achieve these goals is by adjusting interest rates. When prices are rising too quickly and inflation is above the Fed’s 2% target, it raises interest rates, increasing borrowing costs throughout the economy. This results in a stronger US Dollar (USD) as it makes the US a more attractive place for international investors to park their money. When inflation falls below 2% or the Unemployment Rate is too high, the Fed may lower interest rates to encourage borrowing, which weighs on the Greenback.
The Federal Reserve (Fed) holds eight policy meetings a year, where the Federal Open Market Committee (FOMC) assesses economic conditions and makes monetary policy decisions. The FOMC is attended by twelve Fed officials – the seven members of the Board of Governors, the president of the Federal Reserve Bank of New York, and four of the remaining eleven regional Reserve Bank presidents, who serve one-year terms on a rotating basis.
In extreme situations, the Federal Reserve may resort to a policy named Quantitative Easing (QE). QE is the process by which the Fed substantially increases the flow of credit in a stuck financial system. It is a non-standard policy measure used during crises or when inflation is extremely low. It was the Fed’s weapon of choice during the Great Financial Crisis in 2008. It involves the Fed printing more Dollars and using them to buy high grade bonds from financial institutions. QE usually weakens the US Dollar.
Quantitative tightening (QT) is the reverse process of QE, whereby the Federal Reserve stops buying bonds from financial institutions and does not reinvest the principal from the bonds it holds maturing, to purchase new bonds. It is usually positive for the value of the US Dollar.
(The technical analysis of this story was written with the help of an AI tool. Know more.)
Recommended Articles


