Solana price action price and on-chain metrics show signs of weakness

Quelle Fxstreet
  • Solana’s price faces rejection around the previously broken ascending trendline, suggesting a downward trend.
  • On-chain data add credentials to a bearish outlook on SOL’s long-to-short is below one, decreasing development activity.
  • A daily candle stick close above $141.43 would invalidate the bearish thesis.


Solana (SOL) hints at a downward trend as it trades around $132 on Tuesday, following a rejection from the previously broken ascending trendline at $139.80 last week. The bearish outlook is further supported by declining development activity and a long-to-short ratio below one.


Solana price shows signs of weakness

Solana retested but was rejected from the previously broken ascending trendline around $139.80 (drawn by connecting multiple low levels from the end of January) on Friday. It declined 5.3% in the next two days. At the time of writing on Tuesday, it trades at $131.91.

If this trendline and the 50-day EMA at $141.43 continue to hold as resistance, SOL could extend the decline by 9% to its daily support of around $120.91.

This bearish thesis is further supported by the Relative Strength Index (RSI) and the Awesome Oscillator (AO) on the daily chart, which trade below their neutral levels of 50 and zero, respectively. Both momentum indicators suggest that the bears are gaining momentum and indicating a downward trend.
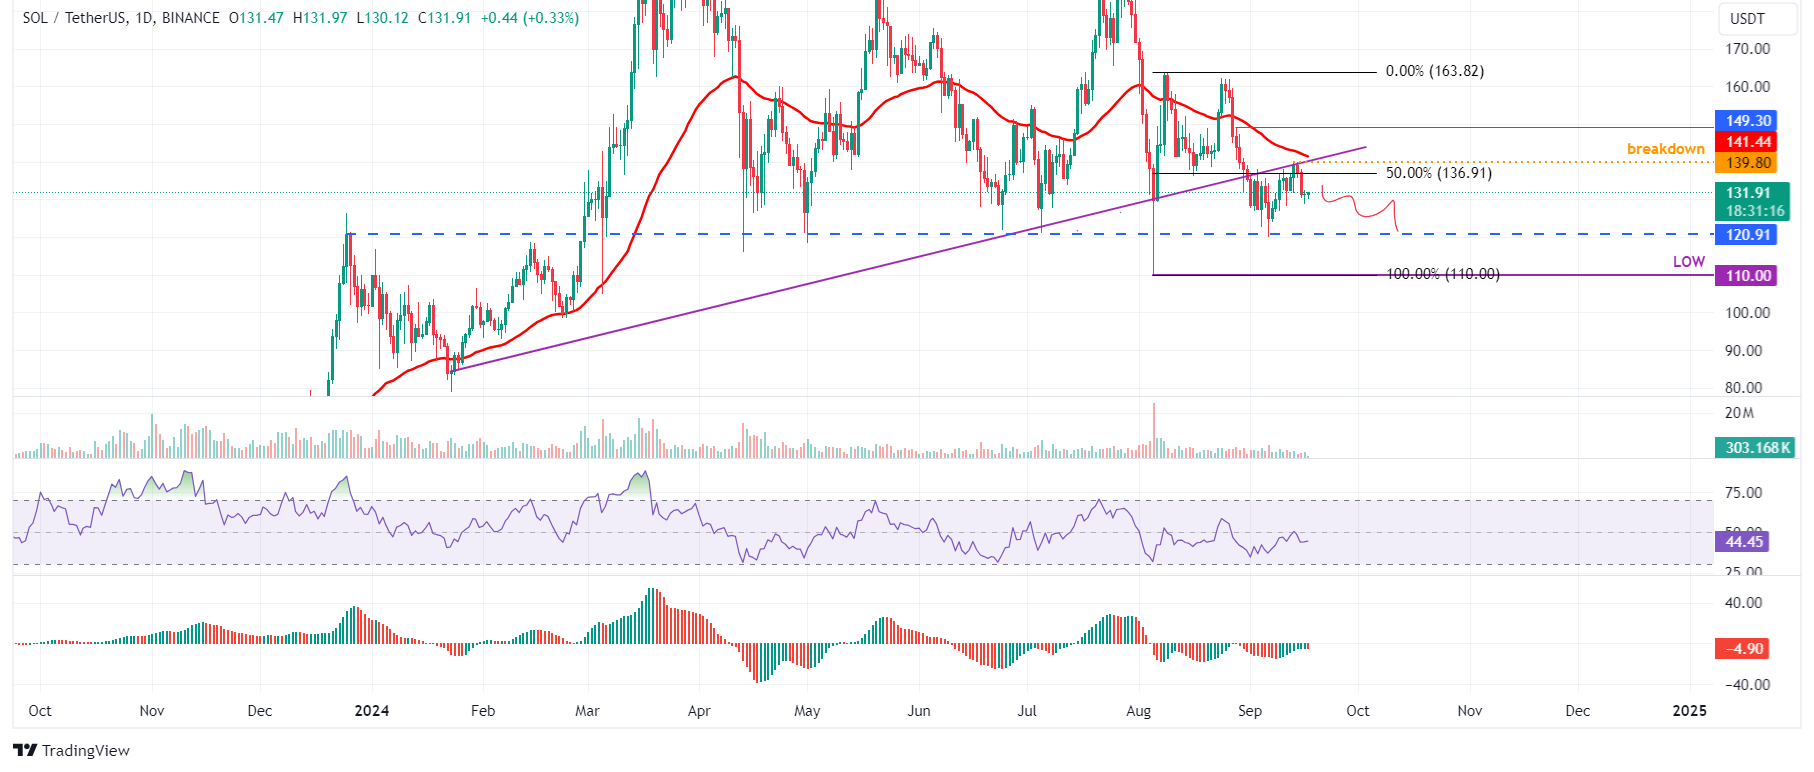
SOL/USDT daily chart

SOL/USDT daily chart

Coinglass data further supports Solana’s bearish outlook. SOL’s long-to-short ratio is at 0.88 and has fallen below one since Friday. This means more traders are betting on the asset’s price to fall. 

SOL long-to-short ratio chart

SOL long-to-short ratio chart

Moreover, Santiment’s Development Activity Index aligns with the bearish picture. This metric shows project development activity over time based on several pure development-related events in the project’s public GitHub repository. 

In SOL’s case, the index sharply falls from 176.95 on Sunday to 166 on Tuesday. This trend has been falling since early September. This suggests that the low level of development activity on Solana reflects waning confidence in its blockchain projects, which, in turn, undermines investor trust and reinforces the negative market sentiment.

SOL Development Activity chart

SOL Development Activity chart

Despite the bearish outlook suggested by the technical analysis and on-chain metrics, If Solana’s daily candlestick closes above $141.43, its 50-day EMA would invalidate the bearish thesis by forming a higher high on the daily time frame. Such a development would raise SOL price by 5% to restest its August 28 high of $149.30

Haftungsausschluss: Nur zu Informationszwecken. Die bisherige Performance ist kein verlässlicher Indikator für zukünftige Ergebnisse.
placeholder
Gold erreicht Zwei-Wochen-Hoch; zielt auf 4.200 $ während dovishe Fed USD-Anstieg und Risikobereitschaft ausgleichtGold zieht am Freitag während der asiatischen Sitzung frische Käufer an und klettert auf ein Zwei-Wochen-Hoch, während die Bullen nun darauf abzielen, die Marke von 4.200 USD zurückzuerobern, angesichts dovisher Erwartungen an die US-Notenbank (Fed)
Autor  FXStreet
vor 10 Stunden
Gold zieht am Freitag während der asiatischen Sitzung frische Käufer an und klettert auf ein Zwei-Wochen-Hoch, während die Bullen nun darauf abzielen, die Marke von 4.200 USD zurückzuerobern, angesichts dovisher Erwartungen an die US-Notenbank (Fed)
placeholder
Pi Network Preisprognose: PI fällt, da die Token-Freigabe im Dezember die Gaming-Partnerschaft überschattetDas Pi Network (PI) ist zum Zeitpunkt der Pressemitteilung am Freitag um 4% gefallen, nachdem es drei Tage lang einen Aufwärtstrend gab, der durch die Ankündigung der Partnerschaft mit CiDi Games am Mittwoch angeheizt wurde
Autor  FXStreet
vor 10 Stunden
Das Pi Network (PI) ist zum Zeitpunkt der Pressemitteilung am Freitag um 4% gefallen, nachdem es drei Tage lang einen Aufwärtstrend gab, der durch die Ankündigung der Partnerschaft mit CiDi Games am Mittwoch angeheizt wurde
placeholder
Zcash-Analyse: Überhitzung durch Kleinanleger – droht ein 30-Prozent-Absturz?Der Artikel zeigt, wie stagnierende Shielded-Pools, überhitztes Retail-Volumen und ein kritischer Test des 50-Tage-EMA bei 436 US-Dollar das Risiko eines über 30%igen Rückgangs bei Zcash erhöhen – und welche Marken für einen möglichen Rebound bis 600 bzw. 750 US-Dollar entscheidend sind.
Autor  Mitrade Team
vor 11 Stunden
Der Artikel zeigt, wie stagnierende Shielded-Pools, überhitztes Retail-Volumen und ein kritischer Test des 50-Tage-EMA bei 436 US-Dollar das Risiko eines über 30%igen Rückgangs bei Zcash erhöhen – und welche Marken für einen möglichen Rebound bis 600 bzw. 750 US-Dollar entscheidend sind.
placeholder
Bullen beißen sich an der 54,50-Dollar-Marke die Zähne ausDer Artikel analysiert, wie Silber nach einem Ein-Monats-Hoch ein mögliches Mehrfach-Top nahe 54,50 US-Dollar ausbildet, warum Rücksetzer in Richtung 53,00 und 52,70–52,65 US-Dollar vorerst als Kaufchance gelten und welche Widerstandsmarken zwischen 54,20 und 55,00 US-Dollar für eine Fortsetzung der Rally entscheidend sind.
Autor  Mitrade Team
vor 11 Stunden
Der Artikel analysiert, wie Silber nach einem Ein-Monats-Hoch ein mögliches Mehrfach-Top nahe 54,50 US-Dollar ausbildet, warum Rücksetzer in Richtung 53,00 und 52,70–52,65 US-Dollar vorerst als Kaufchance gelten und welche Widerstandsmarken zwischen 54,20 und 55,00 US-Dollar für eine Fortsetzung der Rally entscheidend sind.
placeholder
4.200 Dollar im Fadenkreuz – Zinsfantasie entfacht neue KaufwuchtDer Artikel analysiert den Anstieg des Goldpreises auf ein Zwei-Wochen-Hoch, die Rolle dovisher Fed-Erwartungen und geopolitischer Risiken sowie die zentralen Unterstützungs- und Widerstandsmarken rund um 4.170, 4.200 und 4.050–4.040 US-Dollar für die weitere Entwicklung von XAU/USD.
Autor  Mitrade Team
vor 11 Stunden
Der Artikel analysiert den Anstieg des Goldpreises auf ein Zwei-Wochen-Hoch, die Rolle dovisher Fed-Erwartungen und geopolitischer Risiken sowie die zentralen Unterstützungs- und Widerstandsmarken rund um 4.170, 4.200 und 4.050–4.040 US-Dollar für die weitere Entwicklung von XAU/USD.
verbundene Finanzinstrumente
goTop
quote