

Ripple set to begin testing stablecoin launch after ending case with SEC

Quelle Fxstreet
  • Ripple announced the private testing of its stablecoin RLUSD on XRP Ledger and Ethereum.
  • RLUSD is awaiting regulatory approval before users can purchase and trade with it.
  • XRP is down over 6% following the announcement.

Ripple revealed on Friday that it has begun beta testing for its RLUSD stablecoin, pending regulatory approval for its usage. Meanwhile, XRP has declined over 6% in the past 24 hours but could see a rally after the announcement.

XRP down amid Ripple's move to launch USD stablecoin

Ripple has begun testing its US Dollar-backed Ripple USD (RLUSD) stablecoin on the XRP Ledger and Ethereum Mainnet, according to an announcement on its X handle on Friday. The fintech company plans for the stablecoin to be released to the public following approval from regulatory authorities.

The company claims that RLUSD will be fully backed by the US Dollar and pegged to its price 1:1. The asset will also be backed by short-term US Treasuries and other cash equivalents. Ripple also claims that a third-party accounting firm will audit the reserve assets and provide monthly reports.

Ripple initially announced its intention to launch a stablecoin in April. The company states that the stablecoin will help serve users by bringing high-quality assets to the XRP Ledger.

The new milestone comes days after ending a two-year regulatory brawl with the Securities & Exchange Commission (SEC), which lasted four years, dating back to December 2020. The case was finally resolved on Wednesday after a court ruled a $125 million civil penalty fee as opposed to the SEC's request for a $2 billion fine.

Meanwhile, XRP has declined 6.9% in the past 24 hours to $0.57. Many supporters claim that the stablecoin move, coupled with the end of its SEC regulatory hurdle, will prove a bullish catalyst for XRP.

On the daily charts, XRP could decline to fill the liquidity void around the $0.5 price level. A trendline connecting April 13, June 7, July 13 and August 7 could provide support for XRP to see a bounce if it approaches this level.
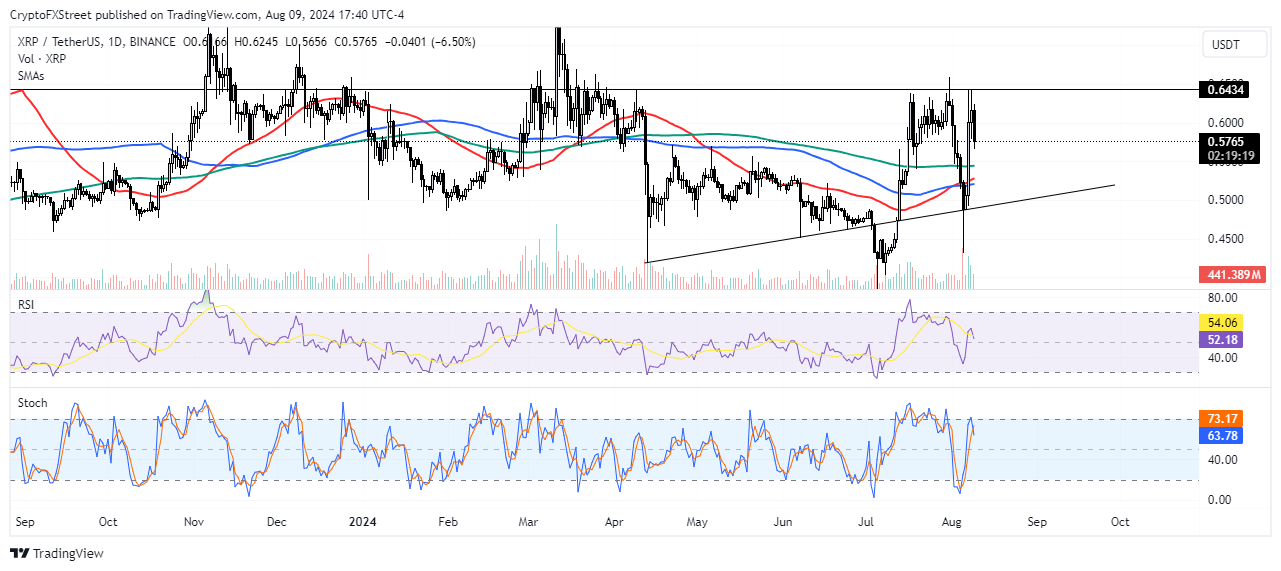
XRP/USDT Daily chart


XRP /USDT Daily chart


The thesis is strengthened by the Relative Strength Index (RSI) line moving below the yelllow moving average line and the Stochastic Oscillator %K line crossing below the %D line.

An upward move above $0.64 will invalidate the bearish thesis.

Haftungsausschluss: Nur zu Informationszwecken. Die bisherige Performance ist kein verlässlicher Indikator für zukünftige Ergebnisse.
placeholder
WTI fällt auf nahezu 82,50 $ da die USA und der Iran Angriffe für mögliche Diplomatie pausierenDer Preis für West Texas Intermediate (WTI) eröffnete mit einer bärischen Kurslücke und fiel um über 7%, wobei er während der asiatischen Handelsstunden am Montag bei rund 82,50 $ pro Barrel gehandelt wurde. Die Rohölpreise gaben nach, nachdem die Vereinigten Staaten (US) und der Iran ihre Angriffe über das Wochenende ausgesetzt hatten, nach zwei Wochen direkter Angriffe.
Autor  FXStreet
vor 16 Stunden
Der Preis für West Texas Intermediate (WTI) eröffnete mit einer bärischen Kurslücke und fiel um über 7%, wobei er während der asiatischen Handelsstunden am Montag bei rund 82,50 $ pro Barrel gehandelt wurde. Die Rohölpreise gaben nach, nachdem die Vereinigten Staaten (US) und der Iran ihre Angriffe über das Wochenende ausgesetzt hatten, nach zwei Wochen direkter Angriffe.
placeholder
WTI-Preisprognose: Fällt auf nahe 90,00 USD, während die bullishe Struktur intakt bleibtWest Texas Intermediate (WTI), die US-Rohöl-Benchmark, wird am Freitag in den frühen europäischen Handelsstunden bei rund 90,05 USD gehandelt. WTI fällt, da Händler einige Gewinne mitnehmen.
Autor  FXStreet
Fr. 24.Jul
West Texas Intermediate (WTI), die US-Rohöl-Benchmark, wird am Freitag in den frühen europäischen Handelsstunden bei rund 90,05 USD gehandelt. WTI fällt, da Händler einige Gewinne mitnehmen.
placeholder
Goldpreis Prognose: Jetzt steht Gold vor der wichtigsten Entscheidung seit WochenDer Goldpreis steht wieder an einem Punkt, an dem Anleger ganz genau hinsehen sollten. Die Gold-Futures (GC1!) notieren aktuell bei 4.128,90 US-Dollar auf Tagesbasis. Das klingt zunächst nach einer normalen Kursbewegung. Ist es aber nicht.
Autor  FXStreet
Do. 23.Jul
Der Goldpreis steht wieder an einem Punkt, an dem Anleger ganz genau hinsehen sollten. Die Gold-Futures (GC1!) notieren aktuell bei 4.128,90 US-Dollar auf Tagesbasis. Das klingt zunächst nach einer normalen Kursbewegung. Ist es aber nicht.
placeholder
Silber Tages-Chart: Erholung stößt auf 20-Tage-EMA-HürdeDer Silberpreis (XAG/USD) gibt einen Teil seiner frühen Gewinne wieder ab, liegt im europäischen Handel am Mittwoch aber immer noch 0,8 % höher bei rund 59,25 USD.
Autor  FXStreet
Mi. 22.Jul
Der Silberpreis (XAG/USD) gibt einen Teil seiner frühen Gewinne wieder ab, liegt im europäischen Handel am Mittwoch aber immer noch 0,8 % höher bei rund 59,25 USD.
placeholder
Goldpreis Prognose: Unter dieser Marke wird es richtig gefährlichDer Goldpreis steht an einem Punkt, an dem Anleger sehr genau hinschauen sollten. Denn der Tageschart der Gold Futures zeigt aktuell kein entspanntes Bild. Der Preis liegt bei 4.053,32 US-Dollar, aber der dominante Trend zeigt weiterhin nach unten.
Autor  FXStreet
Di. 21.Jul
Der Goldpreis steht an einem Punkt, an dem Anleger sehr genau hinschauen sollten. Denn der Tageschart der Gold Futures zeigt aktuell kein entspanntes Bild. Der Preis liegt bei 4.053,32 US-Dollar, aber der dominante Trend zeigt weiterhin nach unten.
verbundene Finanzinstrumente
goTop
quote