

Solana partners with Anchorage Digital to introduce custody support for SOL-based tokens
- Solana’s price moves inside a symmetrical triangle pattern, signaling uncertainty among investors.
- Solana partners with Anchorage Digital to add custody support for tokens on the SOL blockchain.
- A daily candlestick close below $122.77 would invalidate the bullish thesis.
Solana's (SOL) price has been consolidating within a symmetrical triangle pattern since May, signaling uncertainty among investors. On Wednesday, SOL rises by 5.5% to $154.10 at the time of writing, reinforced by Solana's partnership with Anchorage Digital to provide custody support for SOL blockchain tokens, signaling positive momentum in the coming days.
Solana partners with Anchorage Digital to add custody support for tokens on the SOL blockchain
On Wednesday, Anchorage Digital Bank N.A., the sole federally chartered crypto bank in the US, announced expanded support for the Solana ecosystem. Institutions can now custody SPL tokens alongside native SOL, benefiting from Anchorage's robust safety and security measures. The SPL token standard facilitates interoperability across the Solana network, enhancing the ecosystem.
As a certified qualified custodian, Anchorage Digital Bank collaborates with top crypto protocols to simplify institutional involvement through custody, staking, treasury management, and other services. Having supported native SOL custody since 2022 and staking since 2023, the recent addition of SPL token support represents the latest step in addressing the growing institutional demand for access to the Solana ecosystem.
Institutional demand for access to the @solana ecosystem is increasing.
— Anchorage Digital (@Anchorage) August 6, 2024
That’s why @Anchorage Digital Bank is proud to expand custody support for eight SPL tokens in addition to @solana's native SOL token.
Learn more ⬇️:https://t.co/5ot0H6W6le pic.twitter.com/QenQ3bsJnX
Solana price sets for a rally following a break above the symmetrical triangle pattern
Solana price has produced multiple lower highs and higher lows since February's end. Connecting these swing points using trend lines reveals a symmetrical triangle formation in the three-day chart below. This technical pattern has no bias, and the target is obtained by adding the triangle's height to the breakout point.
Assuming SOL triggers a bullish breakout at roughly $184.74, the triangle's height sets the target near $295.80. On its way up, SOL price could find resistance at the April 1 high at $204.46.
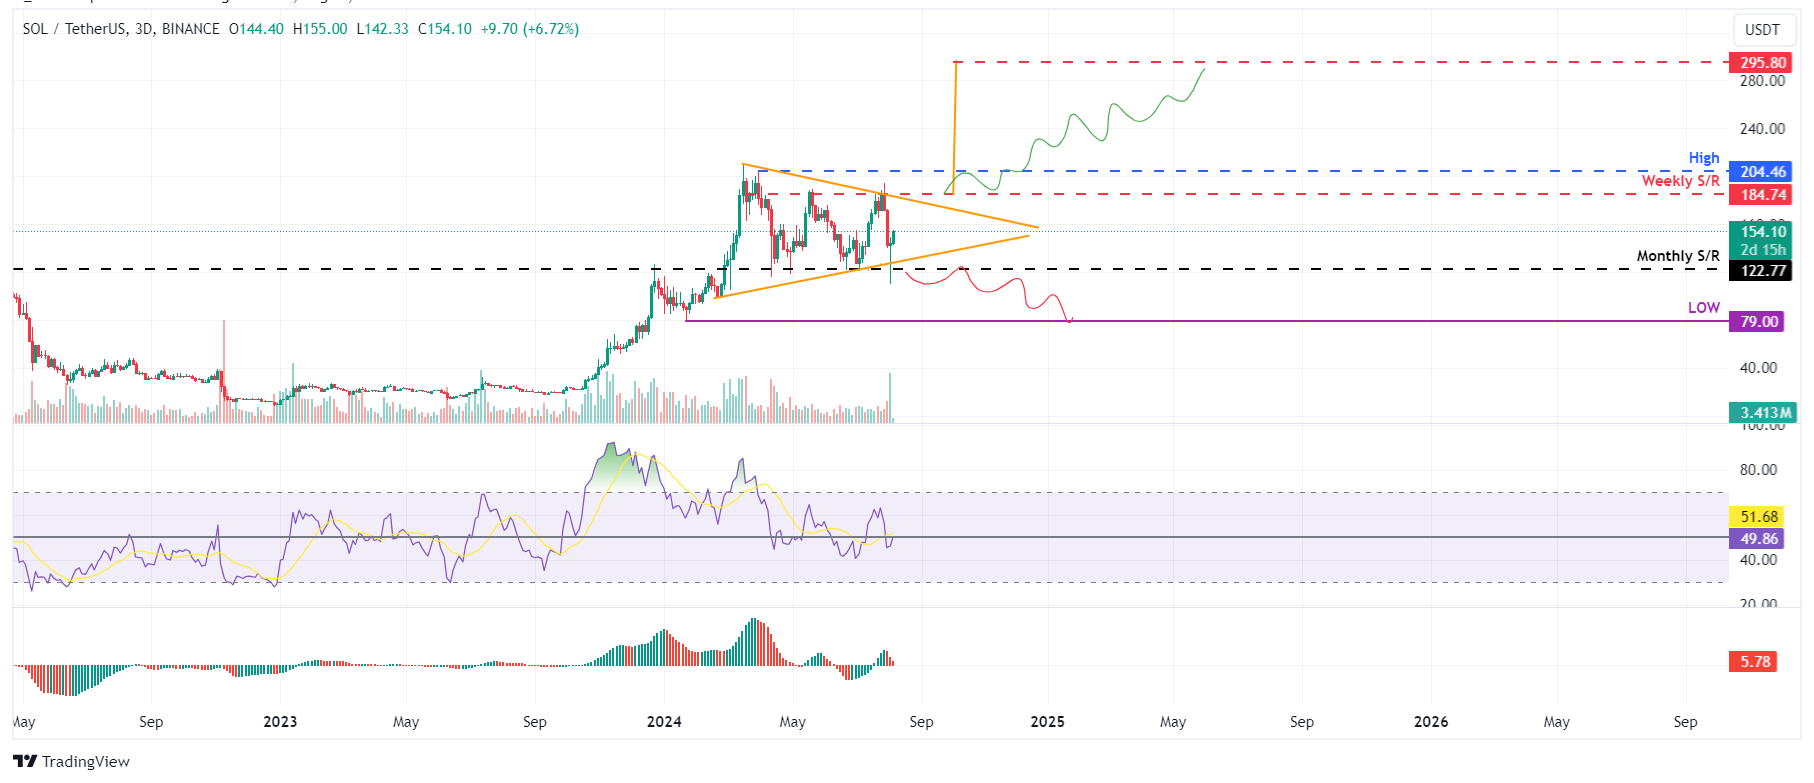
SOL/USDT three-day chart
However, if SOL breaks the upward trendline of the triangle and closes below the monthly support level at $122.77, the bullish thesis could be invalidated, leading to a 36% crash to retest the January 22 low of $79.
Empfohlene Artikel


