Uniswap, Shiba Inu are undervalued while Bitcoin, Ethereum and Toncoin are overvalued, on-chain data shows

Quelle Fxstreet
  • On-chain metrics identify crypto tokens as undervalued and overvalued based on trader returns. 
  • Santiment’s MVRV Z-Score reveals Bitcoin, Ethereum and Toncoin are overvalued, Uniswap and Shiba Inu are undervalued. 
  • UNI, SHIB prices dropped 9% and 4% this week. 

Data from crypto intelligence tracker Santiment shows that Uniswap (UNI) and Shiba Inu (SHIB) are the most notable large market capitalization assets that are currently undervalued. The data also shows that Bitcoin (BTC), Ethereum (ETH) and Toncoin (TON) are overvalued. 

Uniswap and Shiba Inu present buy opportunity 

On-chain data suggests UNI and SHIB are two undervalued assets and sidelined buyers can “buy” these assets while they are in the “opportunity” zone. BTC, ETH and TON are more likely to witness a correction in their prices, since the assets are overvalued by market participants. 

The Santiment chart shows BTC, ETH and TON are in the overbought territory, DOGE and MATIC are in neutral territory, while UNI and SHIB are undervalued. 

The Market Value to Realized Value (MVRV) Z-score is a metric that helps identify tops and bottoms in asset prices. When MVRV is high, the asset is overvalued, when it is relatively low, it is undervalued, and the territory is marked accordingly in the Santiment chart below. 

MVRV

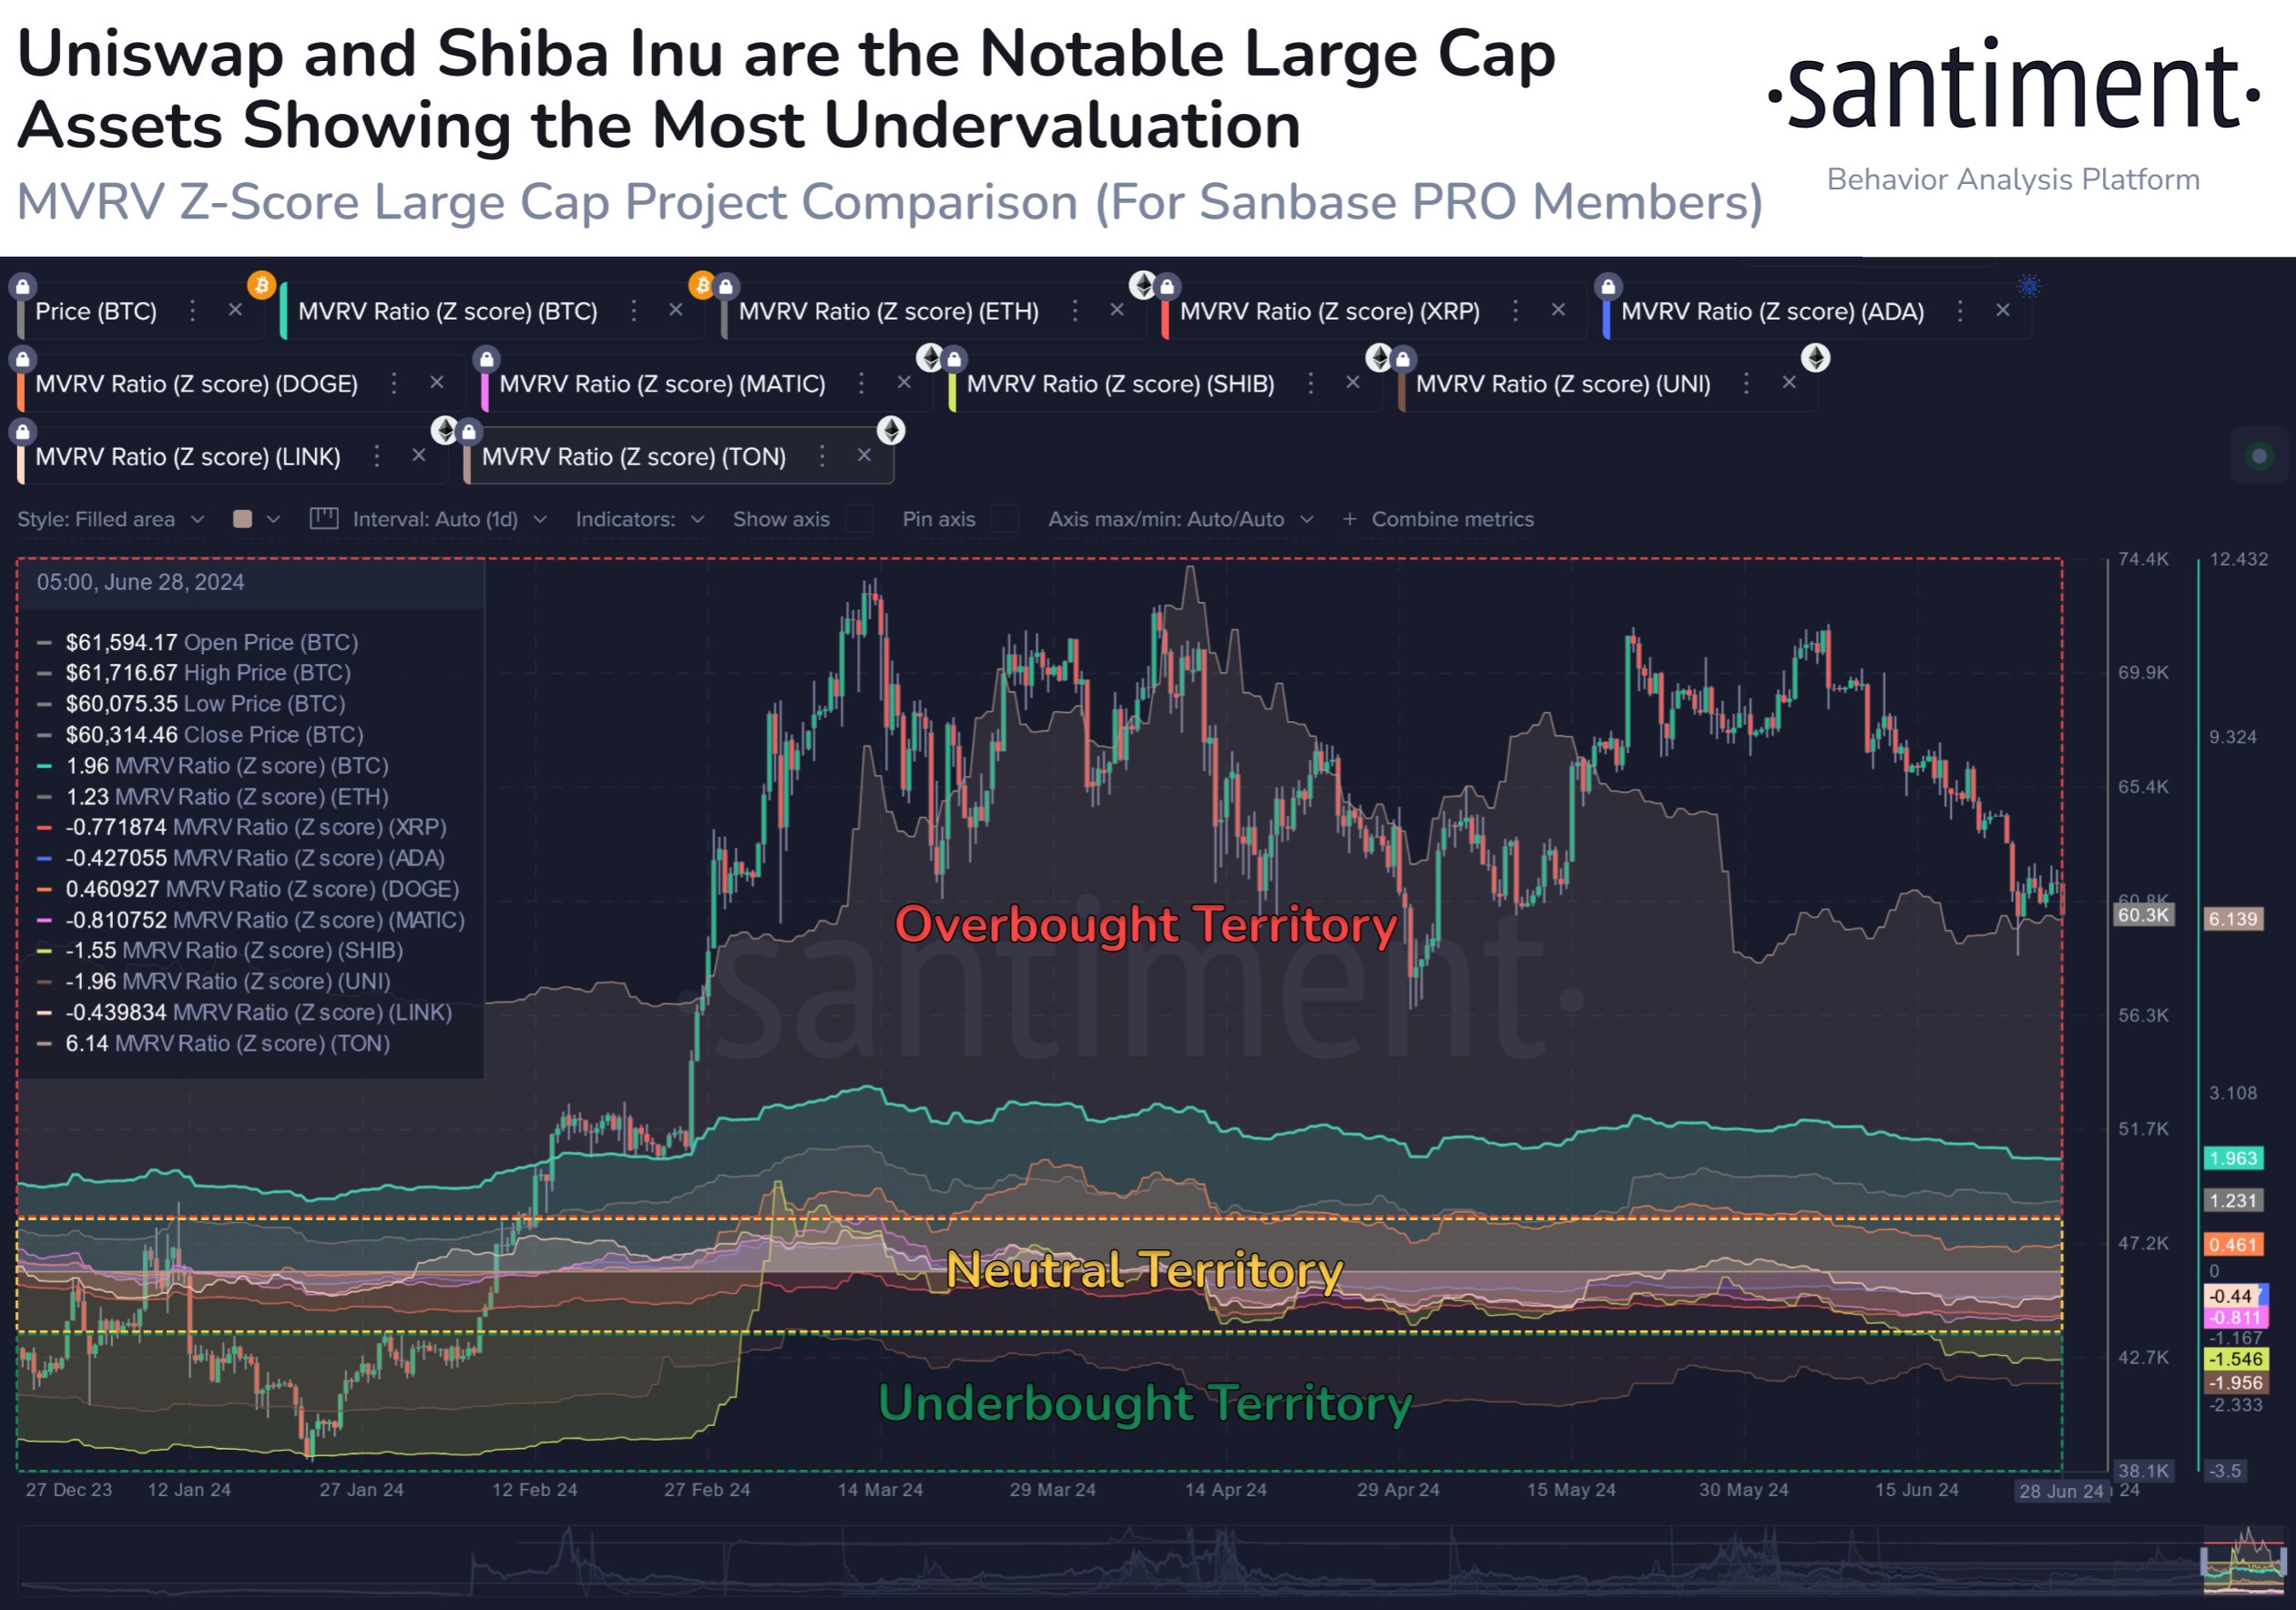
MVRV ratio (Z score) for UNI, SHIB, BTC, ETH, TON

UNI and SHIB have noted a 9% and 4% decline in their prices in the past week. UNI trades at $8.985 on Saturday while SHIB is changing hands at $0.00001714. The two assets are likely to recover based on the on-chain metric. 

BTC, ETH and TON are trading at $61,076, $3,402 and $7.585 respectively. 

Haftungsausschluss: Nur zu Informationszwecken. Die bisherige Performance ist kein verlässlicher Indikator für zukünftige Ergebnisse.
placeholder
Bitcoin, Ethereum und Ripple im freien Fall – Wo liegt der Boden?Bitcoin fällt auf 72.945 $(Tief seit Nov. 2024), Ethereum testet 2.110$. Chartanalyse zu Fibonacci-Levels, RSI-Überverkauftheit und Kurszielen.
Autor  Mitrade Team
Mi. 04.Feb
Bitcoin fällt auf 72.945 $(Tief seit Nov. 2024), Ethereum testet 2.110$. Chartanalyse zu Fibonacci-Levels, RSI-Überverkauftheit und Kurszielen.
placeholder
Solana-Crash: Kurs fällt unter 100 Dollar – Trotz Transaktions-Rekord flüchten AnlegerSOL fällt unter 100 $trotz Rekord-Transaktionen. Institutionelle Zurückhaltung und massive Long-Liquidationen drücken den Kurs Richtung 85$.
Autor  Mitrade Team
Mi. 04.Feb
SOL fällt unter 100 $trotz Rekord-Transaktionen. Institutionelle Zurückhaltung und massive Long-Liquidationen drücken den Kurs Richtung 85$.
placeholder
Der 1-Billion-Dollar-Crash: Analysten sehen "strukturellen" Kollaps bei Bitcoin und Co.Bitcoin fällt unter 65.000 $ (-11%). Analysten warnen vor strukturellem Marktversagen, illiquider Markttiefe und einem Teufelskreis aus Liquidationen.
Autor  Mitrade Team
vor 5 Stunden
Bitcoin fällt unter 65.000 $ (-11%). Analysten warnen vor strukturellem Marktversagen, illiquider Markttiefe und einem Teufelskreis aus Liquidationen.
placeholder
MicroStrategy-Desaster: 12,6 Milliarden Dollar Verlust – Bitcoin-Wette wird zum historischen MilliardengrabMicroStrategy (MSTR) meldet 12,6 Mrd. $Verlust in Q4 2025. Bitcoin-Bestände (713k BTC) rutschen tief ins Minus (unter Cost Basis von 76k$). Aktie verliert 17%.
Autor  Mitrade Team
vor 3 Stunden
MicroStrategy (MSTR) meldet 12,6 Mrd. $Verlust in Q4 2025. Bitcoin-Bestände (713k BTC) rutschen tief ins Minus (unter Cost Basis von 76k$). Aktie verliert 17%.
placeholder
Der 2,6-Milliarden-Dollar-Crash: Bitcoin testet 60.000 – "Extreme Angst" lähmt den Markt2,6 Mrd. $liquidiert, Bitcoin testet 60.000$. Ursachen: ETF-Abflüsse, MicroStrategy-Verlust, Bessents "No Bailout"-Ansage und Geopolitik.
Autor  Mitrade Team
vor 44 Minuten
2,6 Mrd. $liquidiert, Bitcoin testet 60.000$. Ursachen: ETF-Abflüsse, MicroStrategy-Verlust, Bessents "No Bailout"-Ansage und Geopolitik.
goTop
quote