

Crude Oil dips after soft Chinese data adds more downside pressure
- Crude Oil falls slightly with all eyes on the Fed meeting on Wednesday.
- More bearish news for Oil emerged over the weekend, with China’s economic data deteriorating even further.
- The US Dollar Index is under pressure, trading at the lower boundary of September’s bandwidth.
Crude Oil edges down slightly on Monday after more weak Chinese economic data released over the weekend weighs on prices. Price action this week will largely depend on the US Federal Reserve (Fed), which is set to cut interest rates with markets deeply divided over whether rates will be lowered by only 25 basis points (bps) or by 50 bps. Traders would stem a bigger rate cut as supportive of growth and demand, supporting Crude Oil prices.
The US Dollar Index (DXY), which tracks the performance of the US Dollar (USD) against a basket of currencies, is facing downward pressure as well. With a bigger-than-expected rate cut on the cards, the Greenback loses its power over other currencies as rate differentials with other central banks would get tighter. All eyes will be of Fed Chairman Jerome Powell on Wednesday.
At the time of writing, Crude Oil (WTI) trades at $68.16 and Brent Crude at $71.57.
Oil news and market movers: Net bearish against Fed rate cuts
- The Commodity Futures Trading Commission (CFTC) has revealed in its weekly report that traders are net bearish Brent futures for the first time since September 2011. Short positions outnumbered long bets by 12,680 lots in the week ended Sept. 10, Bloomberg reports.
- Libya is still in an impasse over who should control its central bank. UN-led talks broke down again with the impasse still in place. This in its turn causes the country’s crude exports to continue to slump, Reuters reports.
- Meanwhile, Houthi rebels claim to have fired hypersonic missiles during their attacks in Israel over the weekend, the New York Times reports. The rare attack is an illustration of how the conflict is picking up in the Middle East.
- A streak of Chinese economic data published on Saturday showed that Industrial Production, Retail Sales and Fixed Asset Investment grew at a slower pace than expected in August. Lower economic activity in China means less demand for Oil.
Oil Technical Analysis: Opposing forces with one question at hand
Crude Oil price is being torn between bears and bulls, although not much evidence is in favor of the bulls. Several elements are factored in at the moment (sluggish global demand, disappointing Chinese data, production normalization from OPEC), but one element is still to come and could snap the rud for Crude Oil: the Fed rate decision. A bigger-than-expected rate cut could see Crude Oil rally in the assumption that demand would pick up and lower rates would unfreeze shelved projects and investments that demand Oil to be developed.
The first level on the upside is $70.00. Once there has been a daily close above the level, $71.46 gets back on the table as the first level to look out for. Ultimately, a return to $75.27 is still possible, but would likely come after a seismic shift in current balances.
Support should be very close by at $68.19, which was the triple bottom back in the summer of 2023. The next level further down the line is $64.38, the low from March and May 2023. Should that level face a second test and snap, $61.65 becomes a target, with of course $60.00 as a psychologically big figure just below it, at least tempting to be tested.
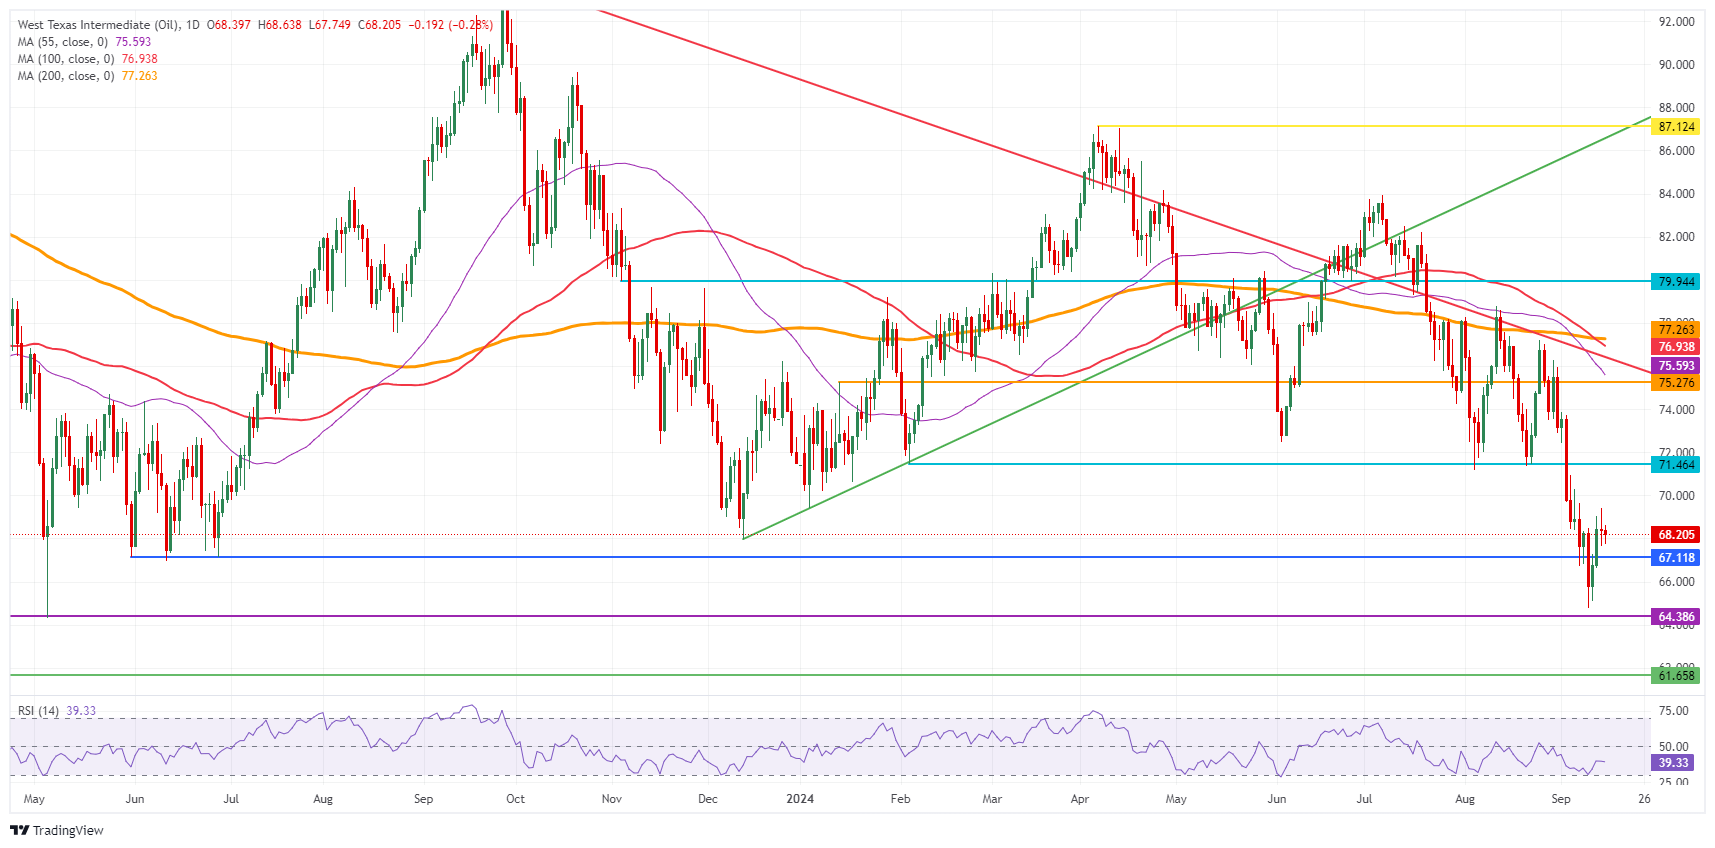
US WTI Crude Oil: Daily Chart
WTI Oil FAQs
WTI Oil is a type of Crude Oil sold on international markets. The WTI stands for West Texas Intermediate, one of three major types including Brent and Dubai Crude. WTI is also referred to as “light” and “sweet” because of its relatively low gravity and sulfur content respectively. It is considered a high quality Oil that is easily refined. It is sourced in the United States and distributed via the Cushing hub, which is considered “The Pipeline Crossroads of the World”. It is a benchmark for the Oil market and WTI price is frequently quoted in the media.
Like all assets, supply and demand are the key drivers of WTI Oil price. As such, global growth can be a driver of increased demand and vice versa for weak global growth. Political instability, wars, and sanctions can disrupt supply and impact prices. The decisions of OPEC, a group of major Oil-producing countries, is another key driver of price. The value of the US Dollar influences the price of WTI Crude Oil, since Oil is predominantly traded in US Dollars, thus a weaker US Dollar can make Oil more affordable and vice versa.
The weekly Oil inventory reports published by the American Petroleum Institute (API) and the Energy Information Agency (EIA) impact the price of WTI Oil. Changes in inventories reflect fluctuating supply and demand. If the data shows a drop in inventories it can indicate increased demand, pushing up Oil price. Higher inventories can reflect increased supply, pushing down prices. API’s report is published every Tuesday and EIA’s the day after. Their results are usually similar, falling within 1% of each other 75% of the time. The EIA data is considered more reliable, since it is a government agency.
OPEC (Organization of the Petroleum Exporting Countries) is a group of 13 Oil-producing nations who collectively decide production quotas for member countries at twice-yearly meetings. Their decisions often impact WTI Oil prices. When OPEC decides to lower quotas, it can tighten supply, pushing up Oil prices. When OPEC increases production, it has the opposite effect. OPEC+ refers to an expanded group that includes ten extra non-OPEC members, the most notable of which is Russia.
Empfohlene Artikel


