

Silver Price Forecast: XAG/USD surrenders some intraday gains after upbeat US data
- Silver price drops from intraday high of $28.44 after resilient US Retail Sales data for July.
- Back-to-back decline in US jobless claims suggest that labor market conditions are not as worse as it was anticipated.
- Strong US Retail Sales have prompted a strong recovery in the US Dollar and bond yields.
Silver price (XAG/USD) gives up some of its intraday gains in Thursday’s New York session after the release of the resilient United States (US) Retail Sales data for July and lower-than-expected number of individuals claiming jobless benefits for the first time in the week ending August 9.
The white metal struggles to hold the crucial support of $28.00 as upbeat US data has boosted the US Dollar (USD) and bond yields. The US Dollar Index (DXY), which tracks the Greenback’s value against six major currencies, bounces back above 103.00. 10-year US Treasury yields soar to near 3.96%. Higher yields on interest-bearing assets weigh on non-yielding assets, such as Silver, by increasing the opportunity cost of holding investment in them.
The Retail Sales, a key measure of consumer spending, returned to expansion and rose at a robust pace of 1% from the estimates of 0.3%. Meanwhile, Initial Jobless Claims came in in lower at 227K than estimates of 235K and the prior release of 234K, upwardly revised from 233K. This is the second consecutive time when number of jobless claims have come in lower than expectations, suggesting that labor market conditions are not as bad as they were indicated by the Nonfarm Payrolls (NFP) data for July.
Meanwhile, the near-term outlook of the Silver price remains firm as investors remain confident that the Federal Reserve (Fed) will begin reducing interest rates from the September meeting. However, upbeat data have dashed hopes the Fed will adopt an aggressive policy-easing stance.
Silver technical analysis
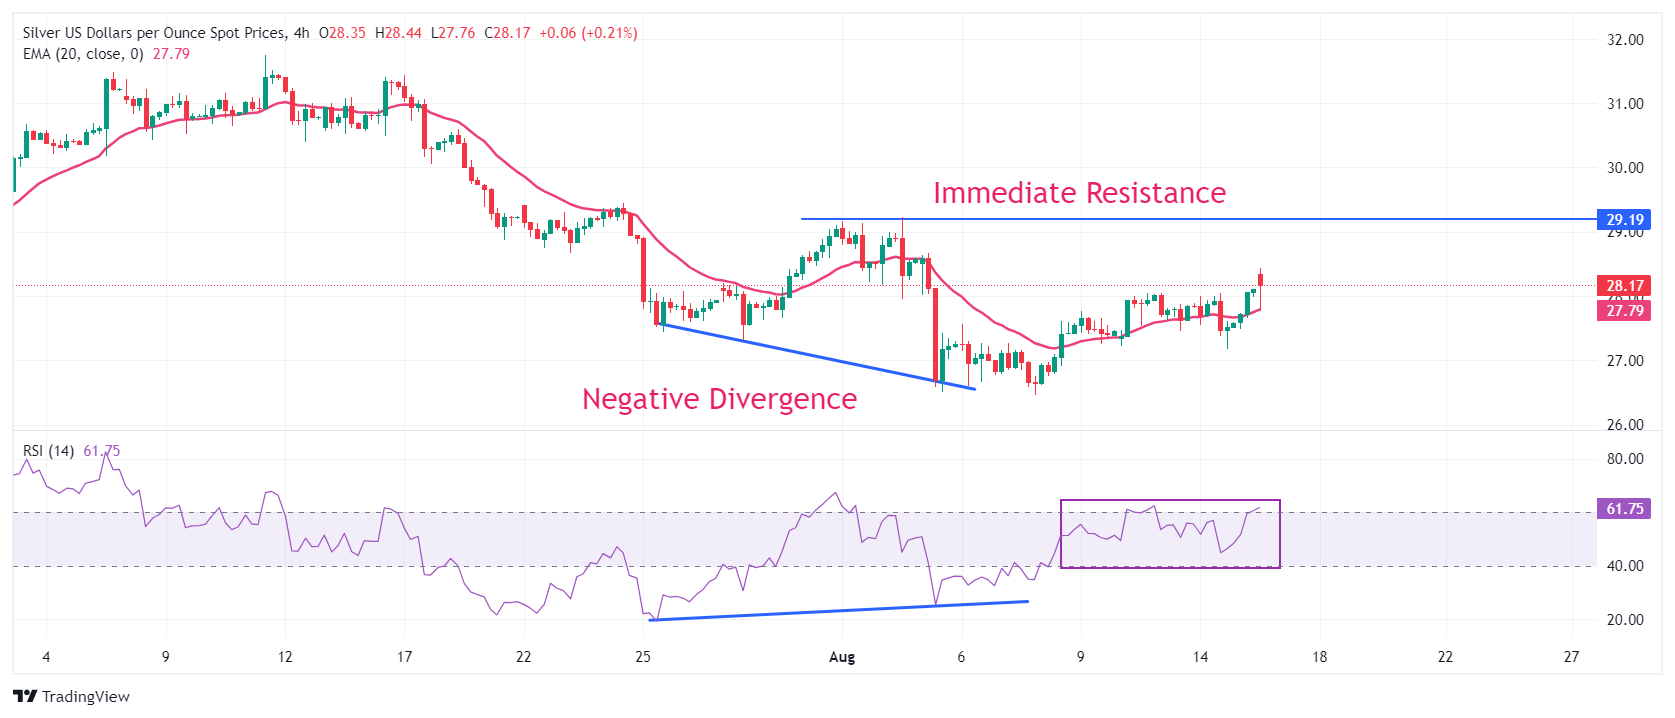
Silver price bounced back after a negative divergence formation on a four-hour timeframe, which shapes when the momentum oscillator refuses to make lower lows, while the asset continues that formation. The 14-period Relative Strength Index (RSI) rebounded from 24.00 without hitting downside below previous low of 20.00.
However, the above-mentioned formation would trigger if the white metal breaks above the immediate swing high plotted from the August 2 high of $29.23.
The asset stays above the 20-period Exponential Moving Average (EMA) near $27.80, suggesting that the near-term trend has leaned on the upside.
The 14-period RSI has bounced back to near 60.00 and a decisive break above the same will trigger the upside momentum.
Silver four-hour chart
Silver FAQs
Silver is a precious metal highly traded among investors. It has been historically used as a store of value and a medium of exchange. Although less popular than Gold, traders may turn to Silver to diversify their investment portfolio, for its intrinsic value or as a potential hedge during high-inflation periods. Investors can buy physical Silver, in coins or in bars, or trade it through vehicles such as Exchange Traded Funds, which track its price on international markets.
Silver prices can move due to a wide range of factors. Geopolitical instability or fears of a deep recession can make Silver price escalate due to its safe-haven status, although to a lesser extent than Gold's. As a yieldless asset, Silver tends to rise with lower interest rates. Its moves also depend on how the US Dollar (USD) behaves as the asset is priced in dollars (XAG/USD). A strong Dollar tends to keep the price of Silver at bay, whereas a weaker Dollar is likely to propel prices up. Other factors such as investment demand, mining supply – Silver is much more abundant than Gold – and recycling rates can also affect prices.
Silver is widely used in industry, particularly in sectors such as electronics or solar energy, as it has one of the highest electric conductivity of all metals – more than Copper and Gold. A surge in demand can increase prices, while a decline tends to lower them. Dynamics in the US, Chinese and Indian economies can also contribute to price swings: for the US and particularly China, their big industrial sectors use Silver in various processes; in India, consumers’ demand for the precious metal for jewellery also plays a key role in setting prices.
Silver prices tend to follow Gold's moves. When Gold prices rise, Silver typically follows suit, as their status as safe-haven assets is similar. The Gold/Silver ratio, which shows the number of ounces of Silver needed to equal the value of one ounce of Gold, may help to determine the relative valuation between both metals. Some investors may consider a high ratio as an indicator that Silver is undervalued, or Gold is overvalued. On the contrary, a low ratio might suggest that Gold is undervalued relative to Silver.
Empfohlene Artikel


