Silver Price Forecast: XAG/USD stays firm above $29 amid firm Fed rate-cut hopes

Quelle Fxstreet
  • Silver price holds the crucial support of $29.00 as Fed rate-cut bets surge.
  • The expectations for Fed rate-cut increase as progress in the US disinflation process has resumed.
  • Investors shift focus to the preliminary US S&P Global PMIs for June.

Silver price (XAG/USD) gains ground above the crucial support of $29.00 in Wednesday’s New York session. The white metal finds buyers amid growing speculation that the Federal Reserve (Fed) will start reducing interest rates from the September meeting.

The expectations for the Fed to begin unwinding its restrictive monetary policy framework rise due to a higher-than-expected United States (US) decline in the Consumer Price Index (CPI) and slower than forecasted growth in Retail Sales data for May. May’s data showed that progress in the disinflation process has resumed, and consumers cut heavily on discretionary spending as high inflation and interest rates by the Federal Reserve (Fed) have reduced the purchasing power of households.

Meanwhile, the market sentiment remains quiet as US markets are closed on Wednesday on account of Juneteenth. The US Dollar Index (DXY) edges down to near 105.20.

This week, investors will focus on the preliminary US S&P Global PMIs data for June, which will be published on Friday. The agency is expected to show a decline in the Composite PMI due to weakness in manufacturing as well as the service sector.

Silver technical analysis

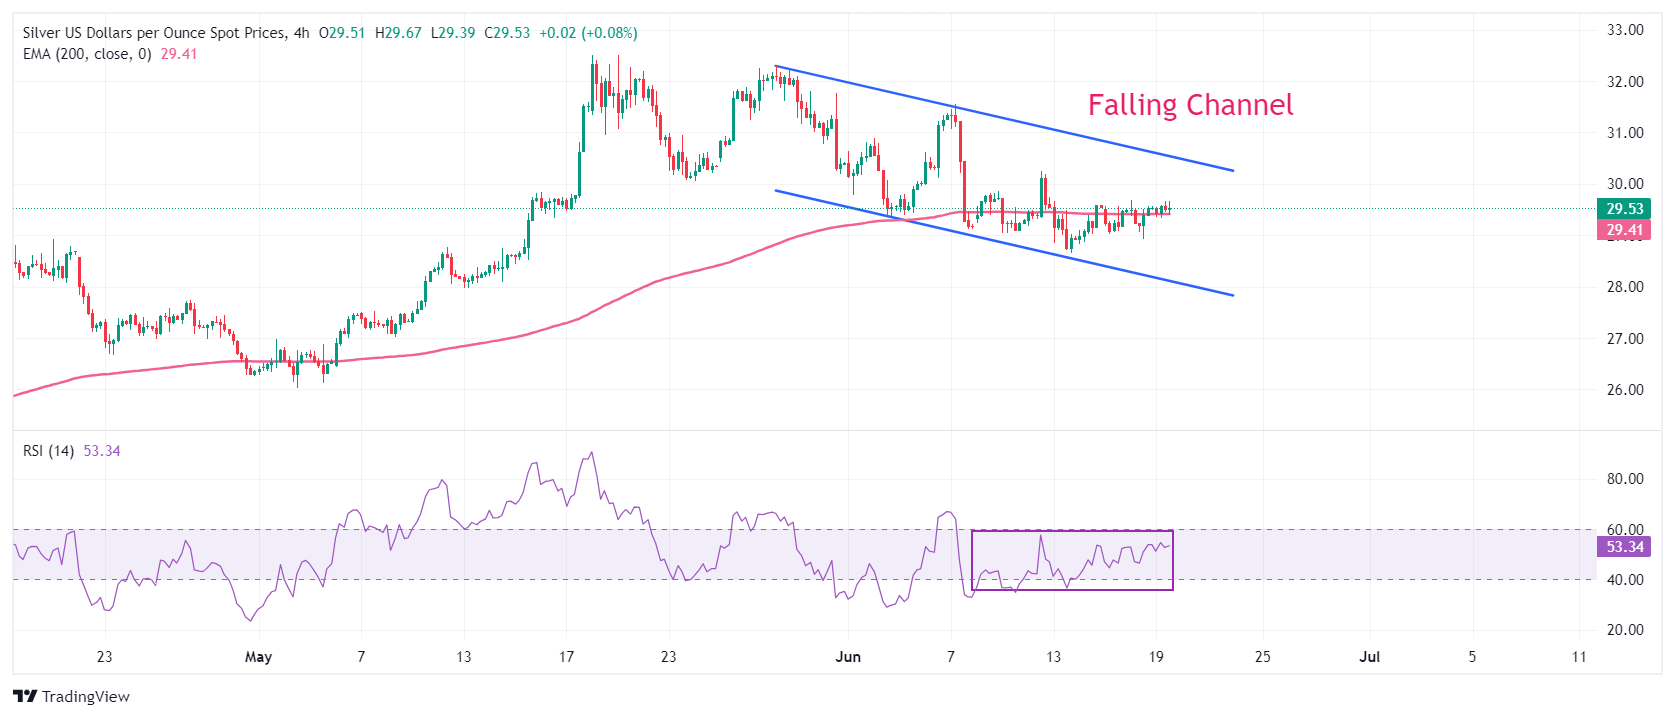
Silver price trades in a Falling Channel chart pattern in which each pullback is considered a selling opportunity by market participants. The asset trades close to the 200-period Exponential Moving Average (EMA), which trades around $29.40, suggesting a consolidating ahead.

The 14-period Relative Strength Index (RSI) oscillates in the 40.00-60.00 range, indicating indecisiveness among market participants.

Silver four-hour chart

XAG/USD

Overview
Today last price 29.53
Today Daily Change -0.01
Today Daily Change % -0.03
Today daily open 29.54
 
Trends
Daily SMA20 30.29
Daily SMA50 29.03
Daily SMA100 26.54
Daily SMA200 24.84
 
Levels
Previous Daily High 29.68
Previous Daily Low 28.93
Previous Weekly High 30.26
Previous Weekly Low 28.66
Previous Monthly High 32.51
Previous Monthly Low 26.02
Daily Fibonacci 38.2% 29.39
Daily Fibonacci 61.8% 29.22
Daily Pivot Point S1 29.09
Daily Pivot Point S2 28.63
Daily Pivot Point S3 28.33
Daily Pivot Point R1 29.84
Daily Pivot Point R2 30.14
Daily Pivot Point R3 30.59


Haftungsausschluss: Nur zu Informationszwecken. Die bisherige Performance ist kein verlässlicher Indikator für zukünftige Ergebnisse.
placeholder
Klimakiller KI: So plündern Big Techs unsere EnergiereservenInvesting.com – Der immense Stromverbrauch von Blockchains wie Bitcoin und Ethereum stand über viele Jahre hinweg im Fokus und wurde stets damit in Verbindung gebracht, wie umweltschädlich diese Techn
Autor  Investing.com
16.Jul. 2024
Investing.com – Der immense Stromverbrauch von Blockchains wie Bitcoin und Ethereum stand über viele Jahre hinweg im Fokus und wurde stets damit in Verbindung gebracht, wie umweltschädlich diese Techn
placeholder
Solana-Ausverkauf: Kurs fällt unter 70 Dollar – Anleger flüchten in ScharenSOL fällt auf 67,50 $ (-23% diese Woche). Open Interest kollabiert auf 5 Mrd. $, RSI extrem überverkauft (19). Kursziel der Bären: 60 $.
Autor  Mitrade Team
Fr. 06.Feb
SOL fällt auf 67,50 $ (-23% diese Woche). Open Interest kollabiert auf 5 Mrd. $, RSI extrem überverkauft (19). Kursziel der Bären: 60 $.
placeholder
Goldpreis Prognose: 75 Prozent Rally! Droht jetzt der Absturz?Der Goldpreis hat Anleger in den vergangenen Monaten elektrisiert. Erst der Durchbruch über die magische Marke von 5.000 US-Dollar, dann neue Hochs – und jetzt der Dämpfer.
Autor  FXStreet
Mi. 25.Feb
Der Goldpreis hat Anleger in den vergangenen Monaten elektrisiert. Erst der Durchbruch über die magische Marke von 5.000 US-Dollar, dann neue Hochs – und jetzt der Dämpfer.
placeholder
Iran eskaliert – Ölpreis und Gold explodieren zum Wochenstart!WTI-Öl und Gold schießen nach oben. Der Grund heißt: Iran. Nach Angriffen von Israel und den USA auf iranische Ziele und einer unmittelbaren Reaktion Teherans steht die Straße von Hormuz faktisch still. Tanker liegen vor Anker, Versicherer schlagen Alarm.
Autor  FXStreet
Mo. 02.Mär
WTI-Öl und Gold schießen nach oben. Der Grund heißt: Iran. Nach Angriffen von Israel und den USA auf iranische Ziele und einer unmittelbaren Reaktion Teherans steht die Straße von Hormuz faktisch still. Tanker liegen vor Anker, Versicherer schlagen Alarm.
placeholder
Gold steigt, da die Nachfrage nach sicheren Häfen aufgrund des Iran-Kriegs zunimmtDer Goldpreis (XAU/USD) baut am Donnerstag seine Gewinne zum zweiten Mal in Folge aus, während die Händler Sicherheit inmitten des anhaltenden Krieges im Nahen Osten suchen
Autor  FXStreet
vor 18 Stunden
Der Goldpreis (XAU/USD) baut am Donnerstag seine Gewinne zum zweiten Mal in Folge aus, während die Händler Sicherheit inmitten des anhaltenden Krieges im Nahen Osten suchen
verbundene Finanzinstrumente
goTop
quote