AUD/JPY Price Analysis: Pair drops to around 107.00, bearish outlook ahead

Quelle Fxstreet
  • AUD/JPY declines to 107.10 while holding just above the 20-day SMA support.
  • A bearish outlook looms for the next few sessions, following a substantial dip from Thursday.

In Friday's trading session, a downward turn was observed for the AUD/JPY pair as it dipped by 0.23% to reach 107.10. This indicative decline marks a notable shift from the previous session's buoyancy, which saw the pair above the 109.00 mark. Present circumstances suggest a bearish outlook for the next few sessions, as it turns evident that the sellers have found their footing.

The daily Relative Strength Index (RSI) for the AUD/JPY marked a significant dip from Thursday's 79 to 54, drifting even near into negative territory. This trend shift hints at a weakening upward momentum, potentially signifying more bearish days ahead. In concert with this, the Moving Average Convergence Divergence (MACD) demonstrates rising red bars.

AUD/JPY daily chart

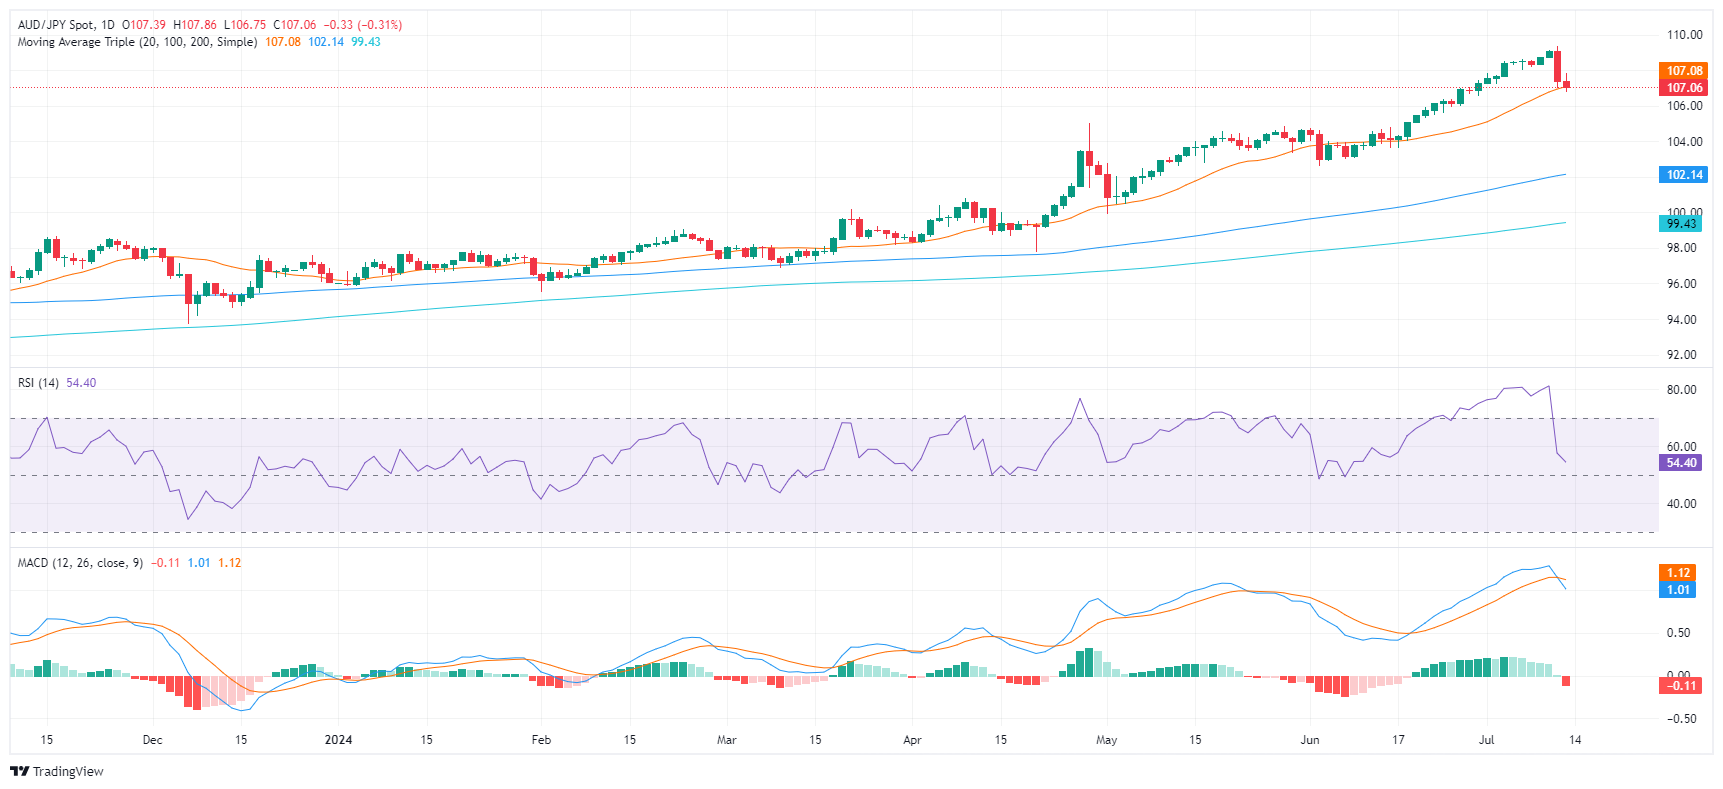
Looking at the broader perspective, the AUD/JPY still displays signs of possible bearish sentiment, given its position just slightly above the 20-day SMA support at 107.10. In case of further downward action, immediate support levels at 107.00 and 106.00 are key areas to watch. However, to avert further potential losses, buyers must target a recovery that extends towards the 108.00 barrier.

Haftungsausschluss: Nur zu Informationszwecken. Die bisherige Performance ist kein verlässlicher Indikator für zukünftige Ergebnisse.
placeholder
Bernstein-Analyse: Bitcoin-Boden bei 60.000 Dollar? Die institutionelle Brandmauer stehtWarum Bitcoin bei 60.000 Dollar den Boden finden könnte und wie ETFs, KI-Miner und die US-Politik eine Erholung im ersten Halbjahr stützen.
Autor  Mitrade Team
Di. 03.Feb
Warum Bitcoin bei 60.000 Dollar den Boden finden könnte und wie ETFs, KI-Miner und die US-Politik eine Erholung im ersten Halbjahr stützen.
placeholder
Bitcoin, Ethereum und Ripple im freien Fall – Wo liegt der Boden?Bitcoin fällt auf 72.945 $(Tief seit Nov. 2024), Ethereum testet 2.110$. Chartanalyse zu Fibonacci-Levels, RSI-Überverkauftheit und Kurszielen.
Autor  Mitrade Team
Gestern 05: 57
Bitcoin fällt auf 72.945 $(Tief seit Nov. 2024), Ethereum testet 2.110$. Chartanalyse zu Fibonacci-Levels, RSI-Überverkauftheit und Kurszielen.
placeholder
Solana-Crash: Kurs fällt unter 100 Dollar – Trotz Transaktions-Rekord flüchten AnlegerSOL fällt unter 100 $trotz Rekord-Transaktionen. Institutionelle Zurückhaltung und massive Long-Liquidationen drücken den Kurs Richtung 85$.
Autor  Mitrade Team
Gestern 06: 10
SOL fällt unter 100 $trotz Rekord-Transaktionen. Institutionelle Zurückhaltung und massive Long-Liquidationen drücken den Kurs Richtung 85$.
placeholder
Strategie-Beben bei Ethereum: Buterin erklärt Rollup-Roadmap für obsoletVitalik Buterin vollzieht radikalen Strategiewechsel und erklärt Rollup-Roadmap für obsolet. ETH-Kurs unter Druck bei 2.280 $.
Autor  Mitrade Team
vor 21 Stunden
Vitalik Buterin vollzieht radikalen Strategiewechsel und erklärt Rollup-Roadmap für obsolet. ETH-Kurs unter Druck bei 2.280 $.
placeholder
Gold erobert 5.000-Dollar-Marke zurück – Oman-Gespräche im FokusXAU/USD steigt auf 5.005 $ wegen Iran-Spannungen. BofA warnt vor Volatilität, während sinkende Zinshoffnungen (46% für Juni) bremsen.
Autor  Mitrade Team
vor 4 Stunden
XAU/USD steigt auf 5.005 $ wegen Iran-Spannungen. BofA warnt vor Volatilität, während sinkende Zinshoffnungen (46% für Juni) bremsen.
verbundene Finanzinstrumente
goTop
quote