AUD/JPY Price Analysis: Faces resistance at Tenkan-Sen, as buyers eye 103.00

Quelle: Fxstreet
08. Mai 2024 19:40
  • AUD/JPY up 0.30%, showing bullish momentum for potential rise beyond 102.35.
  • Bullish RSI indicates room for growth before hitting overbought conditions.
  • Key levels: Resistance at Tenkan-Sen (102.42) and support at Kijun-Sen (101.36).

The AUD/JPY extends its gains for the fifth day in a row, climbs 0.30%, and trades at 102.35. Market sentiment remains upbeat, which usually weighs on the Japanese Yen (JPY) safe-haven appeal, which remains the laggard in the Forex markets against other peers.

AUD/JPY Price Analysis: Technical outlook

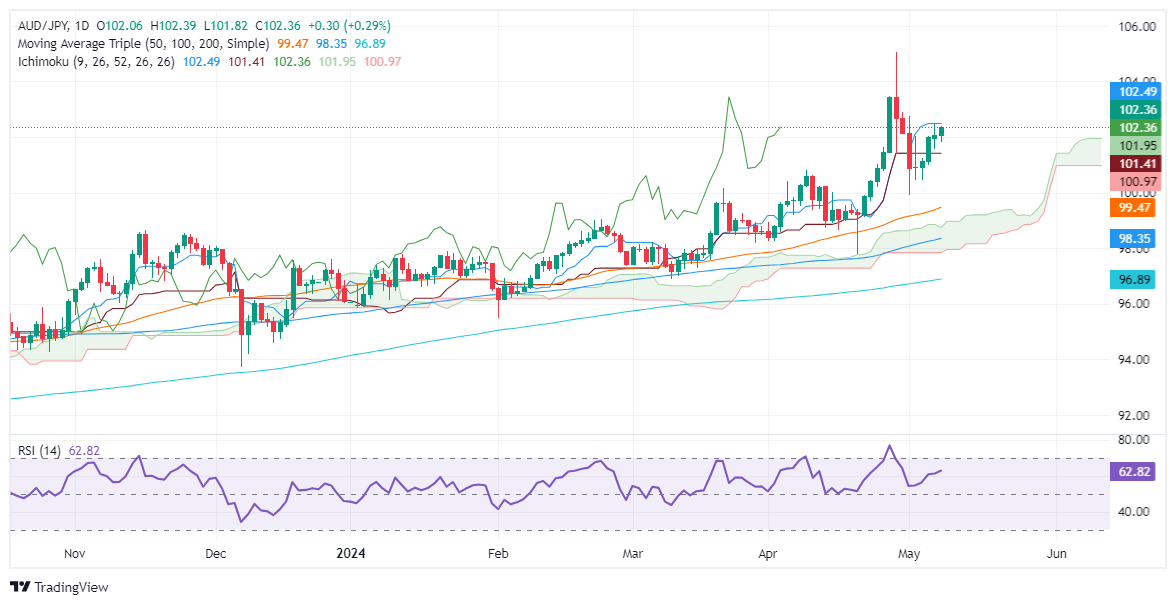
After reaching a year-to-date (YTD) high at 104.95, the AUD/JPY retreated towards 100.00, following a confirmed intervention by the Bank of Japan (BoJ). Since then, the pair has extended its gains, though it faces solid resistance at the Tenkan-Sen at 102.42.

Momentum favors buyers, with the Relative Strength Index (RSI) standing at bullish territory, aiming upwards with enough room before hitting overbought territory.

If AUD/JPY buyers want to re-test the YTD high, they must clear the Tenkan-Sen. Once surpassed, the 103.00 figure would emerge as the next stop, ahead of testing April’s 26 high at 103.47. Up next would be 104.00, followed by the YTD high.

On the other hand, buyers' failure to crack the Tenkan-Sen can pave the way for sellers to step in and push prices lower. The first support would be the 102.00 mark, followed by the Kijun-Sen at 101.36. Further losses are seen at the May 3 low at 100.45, followed by the 100.00 figure.

AUD/JPY Price Action – Daily Chart
AUD/JPY

Overview
Today last price 102.36
Today Daily Change 0.30
Today Daily Change % 0.29
Today daily open 102.06
 
Trends
Daily SMA20 100.66
Daily SMA50 99.38
Daily SMA100 98.29
Daily SMA200 96.85
 
Levels
Previous Daily High 102.47
Previous Daily Low 101.58
Previous Weekly High 105.04
Previous Weekly Low 99.93
Previous Monthly High 105.04
Previous Monthly Low 97.78
Daily Fibonacci 38.2% 102.13
Daily Fibonacci 61.8% 101.92
Daily Pivot Point S1 101.61
Daily Pivot Point S2 101.15
Daily Pivot Point S3 100.72
Daily Pivot Point R1 102.49
Daily Pivot Point R2 102.92
Daily Pivot Point R3 103.38


Haftungsausschluss: Nur zu Informationszwecken. Die bisherige Performance ist kein verlässlicher Indikator für zukünftige Ergebnisse.
placeholder
USD/INR rises to near 83.50 due to the upward correction in the US DollarThe USD/INR pair edges higher to near 83.50 during the early European session on Thursday.
Quelle:  Fxstreet
The USD/INR pair edges higher to near 83.50 during the early European session on Thursday.
placeholder
EUR/GBP Price Analysis: Falling back down inside its multi-month rangeEUR/GBP is falling back inside its multi-month range after temporarily breaking out to the upside on May 7.
Quelle:  Fxstreet
EUR/GBP is falling back inside its multi-month range after temporarily breaking out to the upside on May 7.
placeholder
Pound Sterling steadies after mixed UK Employment reportThe Pound Sterling (GBP) remains in a confined range of around 1.2560 in Tuesday’s London session as investors take time to analyse the United Kingdom Employment data for three months ending in March.
Quelle:  Fxstreet
The Pound Sterling (GBP) remains in a confined range of around 1.2560 in Tuesday’s London session as investors take time to analyse the United Kingdom Employment data for three months ending in March.
verbundene Finanzinstrumente
goTop
quote