EUR/JPY Price Analysis: The first upside barrier will emerge at 167.20

Quelle: Fxstreet
08. Mai 2024 05:21
  • EUR/JPY gains traction near 166.65 in Wednesday's early European session.
  • The cross resumes its uptrend above the key EMA; RSI indicator holds in bullish territory. 
  • The first upside barrier will emerge at 167.20; the initial support level is located at 165.90.

The EUR/JPY cross trades on a positive note for three straight days around 166.65 on Wednesday during the early European session. The Bank of Japan (BoJ) Governor Kazuo Ueda said on Wednesday that the Japanese central bank may take monetary policy action if yen moves have a big impact on inflation. Meanwhile, Japanese Finance Minister Shunichi Suzuki stated that rapid foreign exchange movements are undesirable. Suzuki declined to comment on whether the US has agreed on Japan's FX intervention.

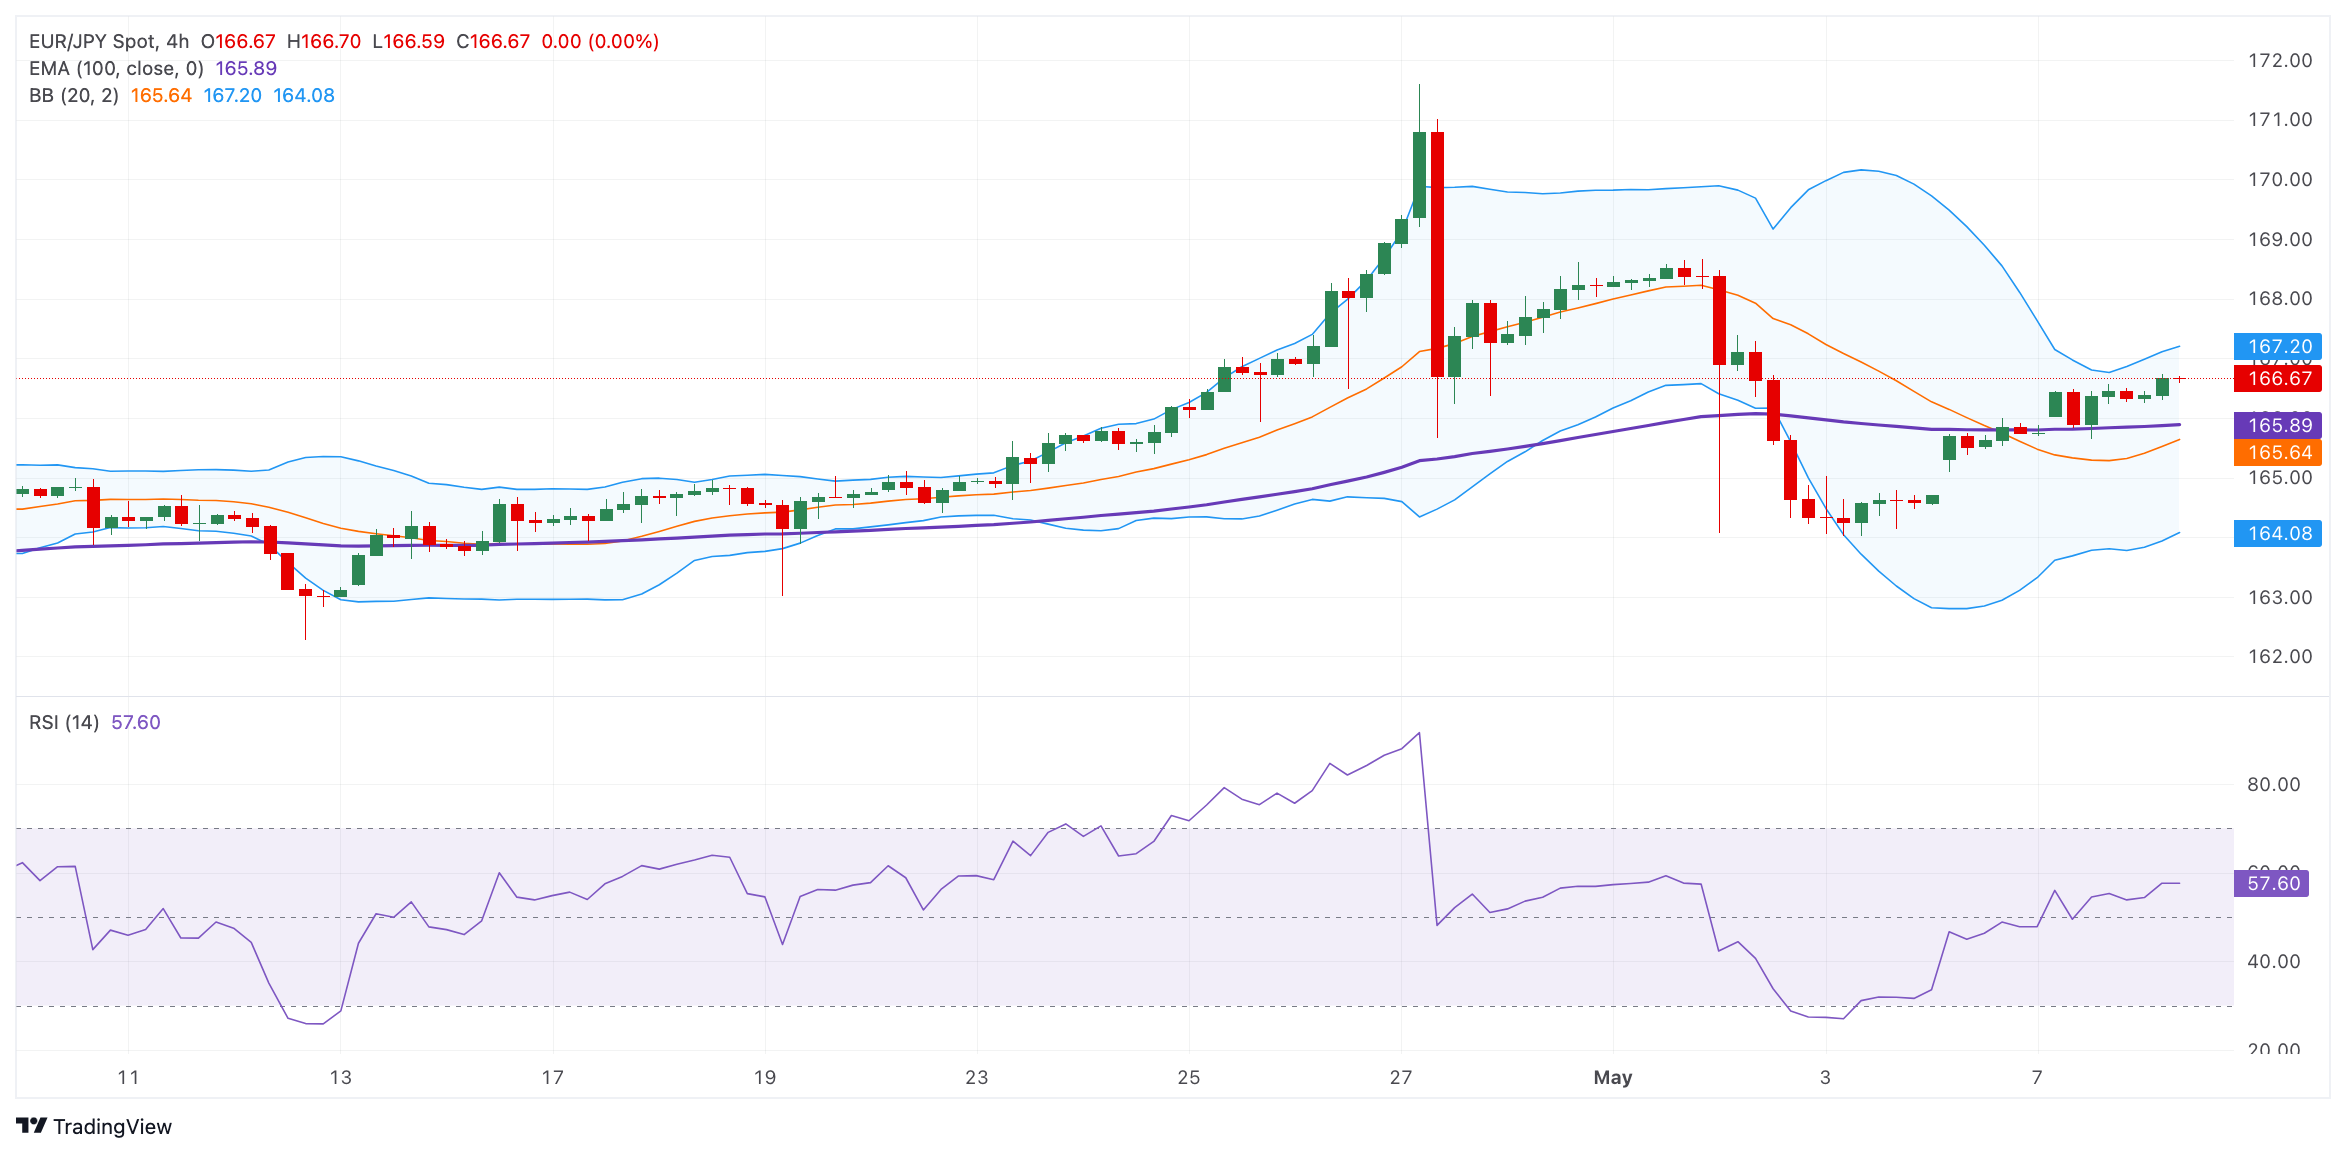
From a technical perspective, EUR/JPY resumes its uptrend as the cross holds above the key 100-period Exponential Moving Averages (EMA) on the four-hour chart. Additionally, the Relative Strength Index (RSI) stands in bullish territory around 58, indicating that further upside looks favorable for the time being. 

The upper boundary of the Bollinger Band at 167.20 acts as an immediate resistance level for the cross. Further north, the next hurdle is located at the 168.00 psychological figure, en route to a high of April 30 at 168.61. Any follow-through buying above the latter will see a rally to a yearly high of 2007 at 168.95. 

On the downside, the initial support level for EUR/JPY is seen near the 100-period EMA at 165.90. A decisive break below this level will see a drop to a low of May 6 at 165.50, followed by the lower limit of the Bollinger Band at 164.08.  

EUR/JPY four-hour chart
EUR/JPY

Overview
Today last price 166.7
Today Daily Change 0.33
Today Daily Change % 0.20
Today daily open 166.37
 
Trends
Daily SMA20 165.54
Daily SMA50 164.09
Daily SMA100 161.89
Daily SMA200 160.32
 
Levels
Previous Daily High 166.57
Previous Daily Low 165.64
Previous Weekly High 171.6
Previous Weekly Low 164.02
Previous Monthly High 171.6
Previous Monthly Low 162.28
Daily Fibonacci 38.2% 166.22
Daily Fibonacci 61.8% 166
Daily Pivot Point S1 165.82
Daily Pivot Point S2 165.26
Daily Pivot Point S3 164.89
Daily Pivot Point R1 166.75
Daily Pivot Point R2 167.12
Daily Pivot Point R3 167.68


Haftungsausschluss: Nur zu Informationszwecken. Die bisherige Performance ist kein verlässlicher Indikator für zukünftige Ergebnisse.
placeholder
USD/CAD edges higher above 1.3600 on firmer US Dollar, Fed’s cautious tonesThe USD/CAD pair trades on a stronger note around 1.3620 on Friday during the early Asian trading hours.
Quelle:  Fxstreet
The USD/CAD pair trades on a stronger note around 1.3620 on Friday during the early Asian trading hours.
placeholder
USD/CAD rebounds above 1.3600, focus on US dataThe USD/CAD pair recovers some lost ground near 1.3615 on Thursday during the early European trading hours.
Quelle:  Fxstreet
The USD/CAD pair recovers some lost ground near 1.3615 on Thursday during the early European trading hours.
placeholder
USD/CAD recovers soft US Inflation-induced losses from 1.3600The USD/CAD pair rebounds sharply after falling to near the round-level support of 1.3600 in Wednesday’s New York session.
Quelle:  Fxstreet
The USD/CAD pair rebounds sharply after falling to near the round-level support of 1.3600 in Wednesday’s New York session.
verbundene Finanzinstrumente
goTop
quote