
EUR/JPY Price Analysis: Remains under selling pressure below 164.50, oversold RSI condition eyed
- EUR/JPY attracts some sellers to 164.40 in Friday’s early European session.
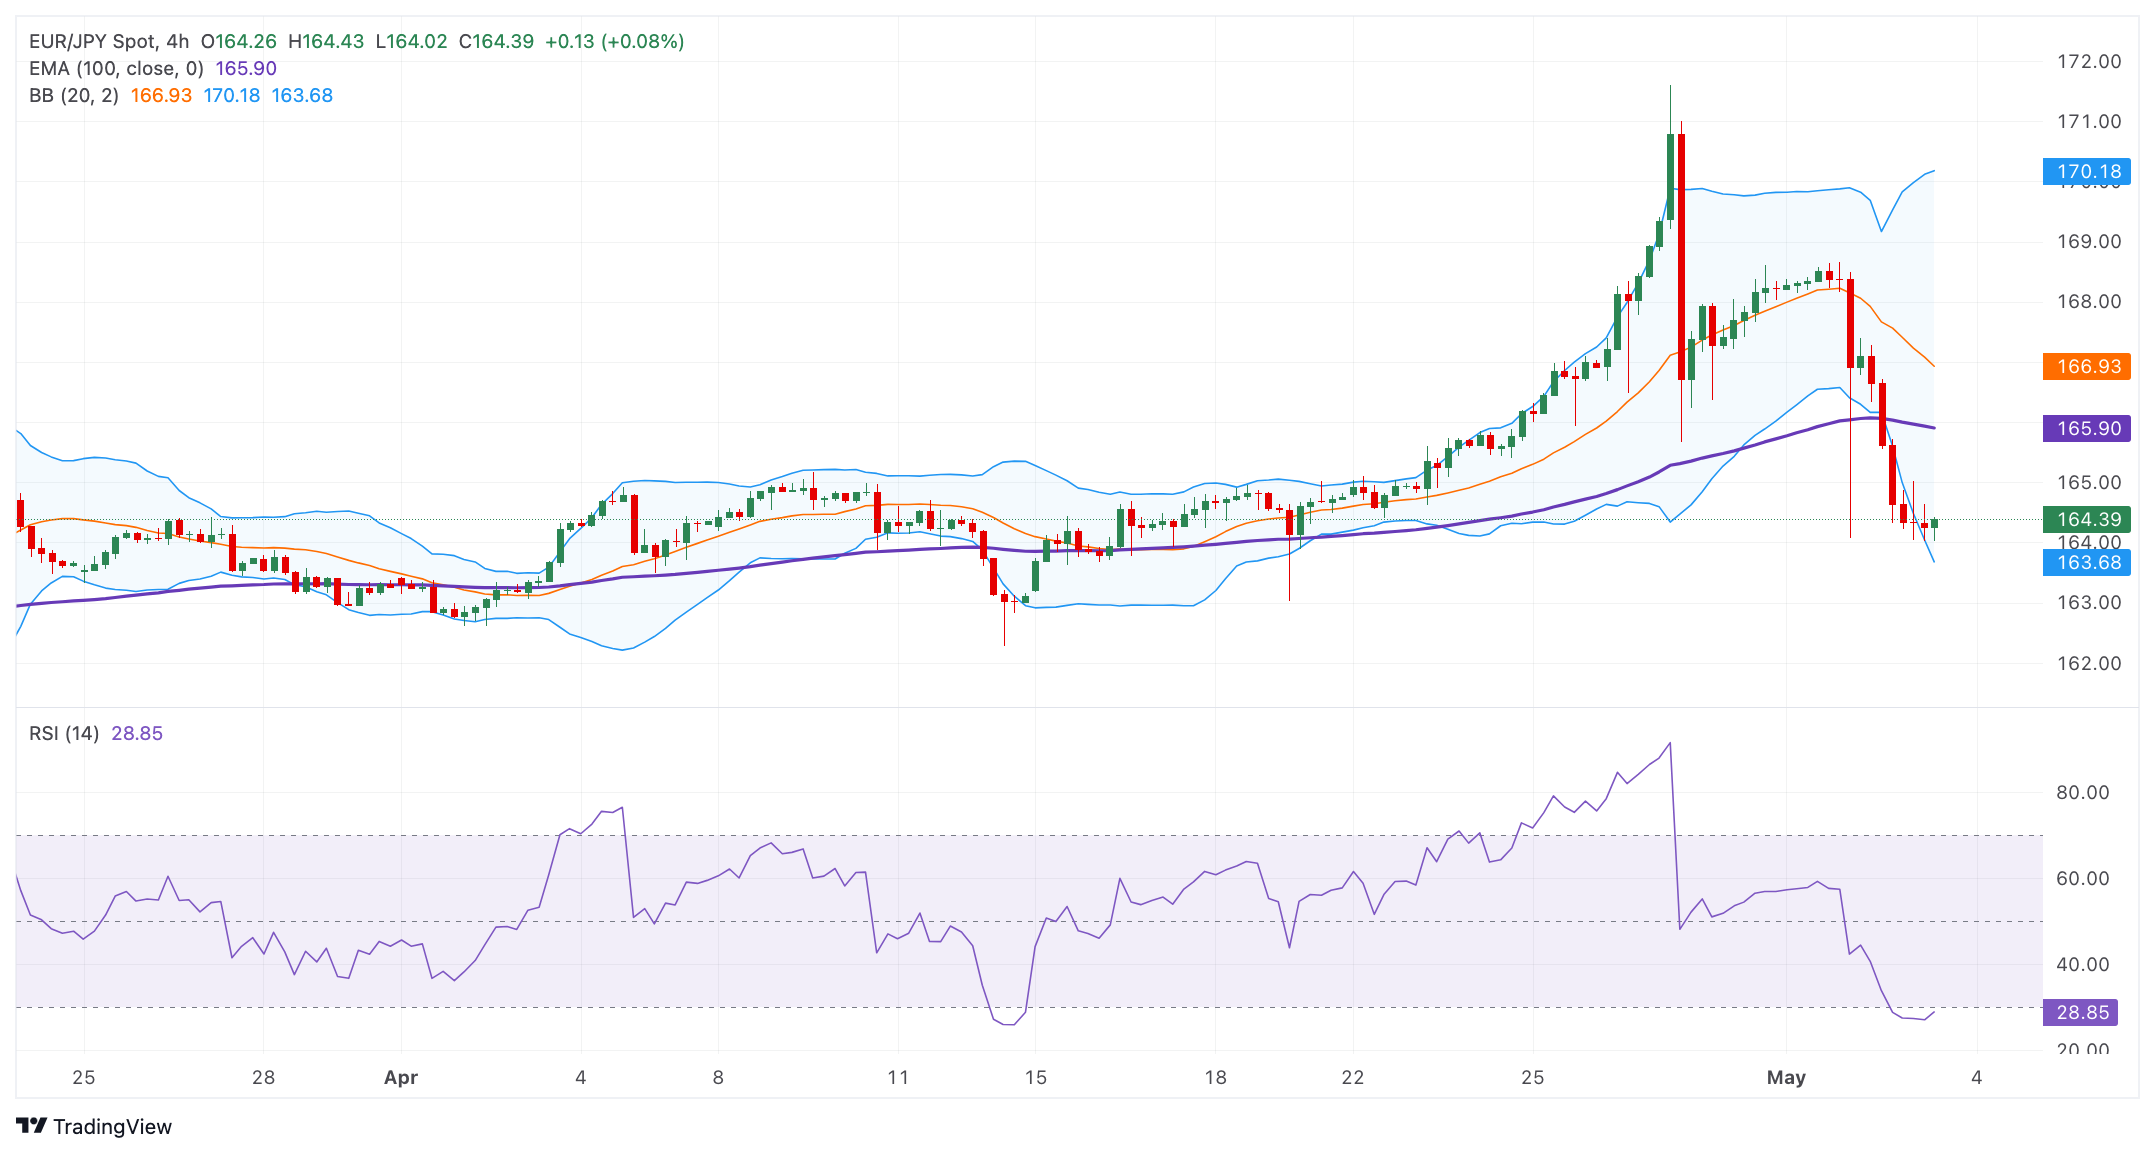
- The cross is below the key EMA with an oversold RSI condition.
- The first downside target is located at 163.67; the immediate resistance level is seen in the 165.90–166.00 zone.
The EUR/JPY cross loses momentum around 164.40 on Friday during the early European trading hours. The cross trades on a softer note for the third consecutive day, despite bouncing off weekly lows of 164.00. The speculation that Japanese authorities will further intervene in the foreign exchange (FX) provides some support to the Japanese Yen (JPY) and creates a headwind for EUR/JPY.
According to the four-hour chart, EUR/JPY keeps the bearish vibe unchanged as the cross holds below the 100-period Exponential Moving Averages (EMA). The Relative Strength Index (RSI) holds in bearish territory below 30. However, the oversold RSI condition indicates that further consolidation cannot be ruled out before positioning for any near-term EUR/JPY depreciation.
The first downside target will emerge near the lower limit of the Bollinger Band at 163.67. Any follow-through selling below the latter will see a drop to a low of April 19 near 163.00. The next contention level to watch is a low of April 12 at 162.28.
On the other hand, the immediate resistance level for the cross is located at the 165.90–166.00 region, representing the 100-period EMA and psychological level. Further north, the next hurdle is seen near a high of May 2 at 167.38. A break above the latter could see a rally to a yearly high of 2007 at 168.95, en route to the upper boundary of the Bollinger Band at 170.18.
EUR/JPY four-hour chart
Verwandte Artikel


