


If a Bear Market Is Coming in 2027, I'm Making This 1 Move Right Now
Key Points
The S&P 500 is getting closer to finishing its fourth year of double-digit gains.
The CAPE ratio and Buffett indicator imply a highly expensive market.
Even though you should continue investing today, you should have cash ready to benefit from bargains in a bear market.
- 10 stocks we like better than S&P 500 Index ›
As the S&P 500 (SNPINDEX: ^GSPC) gets closer to ending its fourth year of double-digit gains, can it keep going up? That's a question every investor should be thinking about. Artificial intelligence (AI) development is driving massive gains for tech companies, but the market is getting more and more expensive, and inflation is still booming.
That means that there's a good chance a bear market might be just around the corner. While investors should be prepared for bear markets and crashes at any time, if you haven't fortified your portfolio with protective stocks yet, now's the time to get started. There's one specific move I'd make today in case a bear market is coming in 2027.
Missed Nvidia in 2009? This Rare Signal Is Flashing Again. In 2009, a "Double Down" signal flashed for a little-known chipmaker called Nvidia. For the first time in years, that same "Total Conviction" signal is flashing for a company 1/100th the size of Nvidia. Continue »
Image source: Getty Images.
Why it could happen in 2027
There are many signs that the bull market might be at its tail end. The most obvious is how expensive it is.
The CAPE ratio, which stands for cyclically adjusted price-to-earnings ratio, measures the average S&P 500 P/E ratio adjusted for inflation, making it a more reliable measure than the standard P/E ratio. The average going back to 1871 is 17.8, and it has only surpassed 40 on two occasions: the dot-com crash, which led to three years of S&P 500 losses, and now.
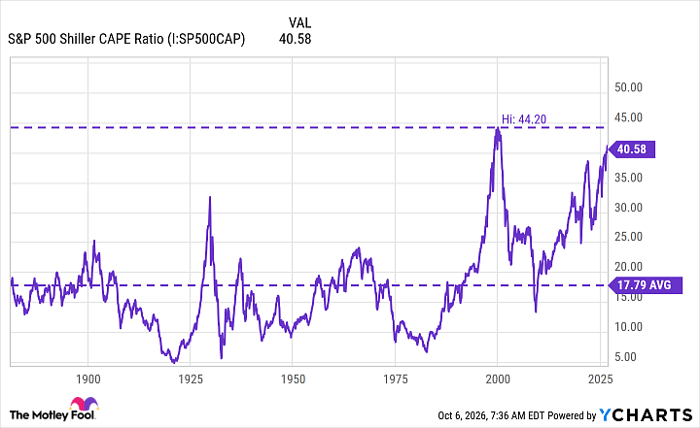
S&P 500 Shiller CAPE Ratio data by YCharts.
Another sign is the "Buffett indicator," named for famed investor Warren Buffett, which measures the total value of the stock market relative to gross domestic product. At 150%, it's expensive, and above 175%, it's extremely expensive. Buffett said that as it approaches 200%, investors are "playing with fire."
Buffett wrote about it in a Fortune magazine article in 2001 after the market crash, and said that the high ratio, which neared 200%, should have been a warning to investors. Today, the Buffett indicator is 302%.
Here's the one move to make
One important thing to keep in mind is that even Buffett's successor, Berkshire Hathaway CEO Greg Abel, is still buying stocks in this climate. One thing you shouldn't do is stop buying. However, Berkshire Hathaway's equity portfolio is packed with defensive and protective stocks like Coca-Cola and American Express -- blue chip dividend stocks that are resilient under pressure.
It also has a massive cash pile that it has built up over the past few years as the market has become more expensive and there are fewer bargains to find.
The move I'd make to prepare for the possibility of a bear market next year is getting some cash ready. Even if you're still investing at what might be the high, you want to be able to grab deals when the market is at a low. If you have to sell at that point to get cash, you'll be turning paper losses into real losses. Instead, I'd put aside some cash in a high-interest account that can be available to invest as soon as you're ready.
Should you buy stock in S&P 500 Index right now?
Before you buy stock in S&P 500 Index, consider this:
The Motley Fool Stock Advisor analyst team just identified what they believe are the 10 best stocks for investors to buy now… and S&P 500 Index wasn’t one of them. The 10 stocks that made the cut could produce monster returns in the coming years.
Consider when Netflix made this list on December 17, 2004... if you invested $1,000 at the time of our recommendation, you’d have $385,972!* Or when Nvidia made this list on April 15, 2005... if you invested $1,000 at the time of our recommendation, you’d have $1,416,196!*
Now, it’s worth noting Stock Advisor’s total average return is 951% — a market-crushing outperformance compared to 214% for the S&P 500. Don't miss the latest top 10 list, available with Stock Advisor, and join an investing community built by individual investors for individual investors.
See the 10 stocks »
*Stock Advisor returns as of October 10, 2026.
American Express is an advertising partner of Motley Fool Money. Jennifer Saibil has positions in American Express. The Motley Fool has positions in and recommends American Express and Berkshire Hathaway. The Motley Fool has a disclosure policy.
Recommended Articles


