


Stock Market Pattern Echoes the Dot-Com Era and History Points to 1 Move Investors Should Make Now
Key Points
The S&P 500 index is trading near all-time highs despite a host of global and economic headwinds.
Investors need to step back and prepare for a bear market, given that the S&P 500's valuation hasn't been this high since the dot-com bubble.
- 10 stocks we like better than S&P 500 Index ›
The internet was the big story at the end of the last century, with the web expected to change the world. It did change the world, but not before Wall Street's enthusiasm created a massive bubble that, eventually, burst in dramatic fashion. Given the massive excitement around artificial intelligence (AI), investors shouldn't ignore the similarities between today and what has now been dubbed the dot-com bubble. Here's why and one move you should make right now.
Valuation and breadth
When the dot-com bubble burst, the S&P 500 Shiller CAPE Ratio had hit an all-time high of roughly 44x. That ratio is back above 40x, hitting its highest level since the dot-com bubble period. The S&P 500 Shiller CAPE Ratio is basically a P/E for the S&P 500 that smooths earnings, adjusted for inflation, over a 10-year period. Since earnings can be volatile over short-term periods, this index can provide a more accurate view of valuation.
Missed Nvidia in 2009? This Rare Signal Is Flashing Again. In 2009, a "Double Down" signal flashed for a little-known chipmaker called Nvidia. For the first time in years, that same "Total Conviction" signal is flashing for a company 1/100th the size of Nvidia. Continue »

Image source: Getty Images.
On top of that, in recent trading, more stocks have hit 52-week lows than 52-week highs. That's occurred even on days when the S&P 500 has risen. That's something that last happened just before the dot-com bubble burst. Given that investors have been talking about the risk of an artificial intelligence bubble, another new technology expected to change the world, now is not the time for complacency.
The one move you should make right now
It is appropriate to be concerned about the risk of a bear market right now. However, you shouldn't panic and sell everything. What you need to do is assess your risk tolerance. During the dot-com bubble, the S&P 500 index (SNPINDEX: ^GSPC) fell by nearly 40%, while the technology-stock-heavy Nasdaq Composite (NASDAQINDEX: ^IXIC) dropped by nearly 80%. Worse, the bear market lasted for roughly three years. It was brutal to live through that.
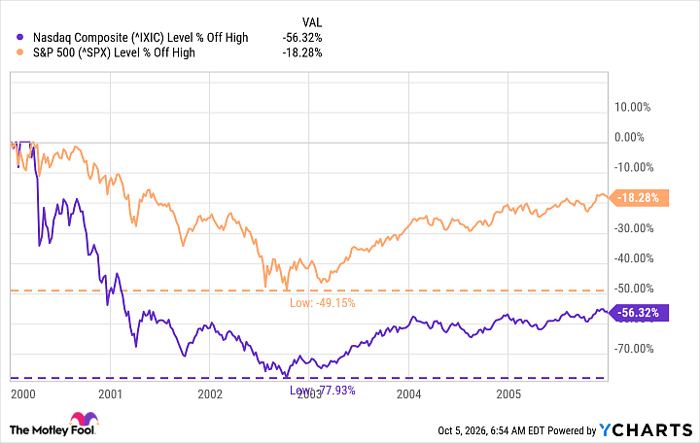
^IXIC data by YCharts
Could you live through a downturn like that and still own the portfolio you currently own? If the answer is no, then think about making changes now. Consider allowing cash to accumulate rather than investing it all right away. Contemplate shifting into sectors that are more resilient to adversity, such as consumer staples and utilities. And give serious thought to paring back some of your biggest winners and most aggressive bets (especially if they are in the AI sector).
Don't give up on your investment approach if it is sound and based on long-term history. But do think about shifting to a more conservative stance as you carefully consider what it would mean if the market, echoing the dot-com era's excesses, is suggesting the AI bubble could be about to burst. You want to prepare in advance so you don't end up making panic-driven, short-term decisions that negatively impact your long-term wealth.
Should you buy stock in S&P 500 Index right now?
Before you buy stock in S&P 500 Index, consider this:
The Motley Fool Stock Advisor analyst team just identified what they believe are the 10 best stocks for investors to buy now… and S&P 500 Index wasn’t one of them. The 10 stocks that made the cut could produce monster returns in the coming years.
Consider when Netflix made this list on December 17, 2004... if you invested $1,000 at the time of our recommendation, you’d have $379,123!* Or when Nvidia made this list on April 15, 2005... if you invested $1,000 at the time of our recommendation, you’d have $1,408,822!*
Now, it’s worth noting Stock Advisor’s total average return is 950% — a market-crushing outperformance compared to 215% for the S&P 500. Don't miss the latest top 10 list, available with Stock Advisor, and join an investing community built by individual investors for individual investors.
See the 10 stocks »
*Stock Advisor returns as of October 11, 2026.
Reuben Gregg Brewer has no position in any of the stocks mentioned. The Motley Fool has no position in any of the stocks mentioned. The Motley Fool has a disclosure policy.
Recommended Articles


