


Crude Oil rallies into 14-week highs as US and Iran spend the week attacking tankers
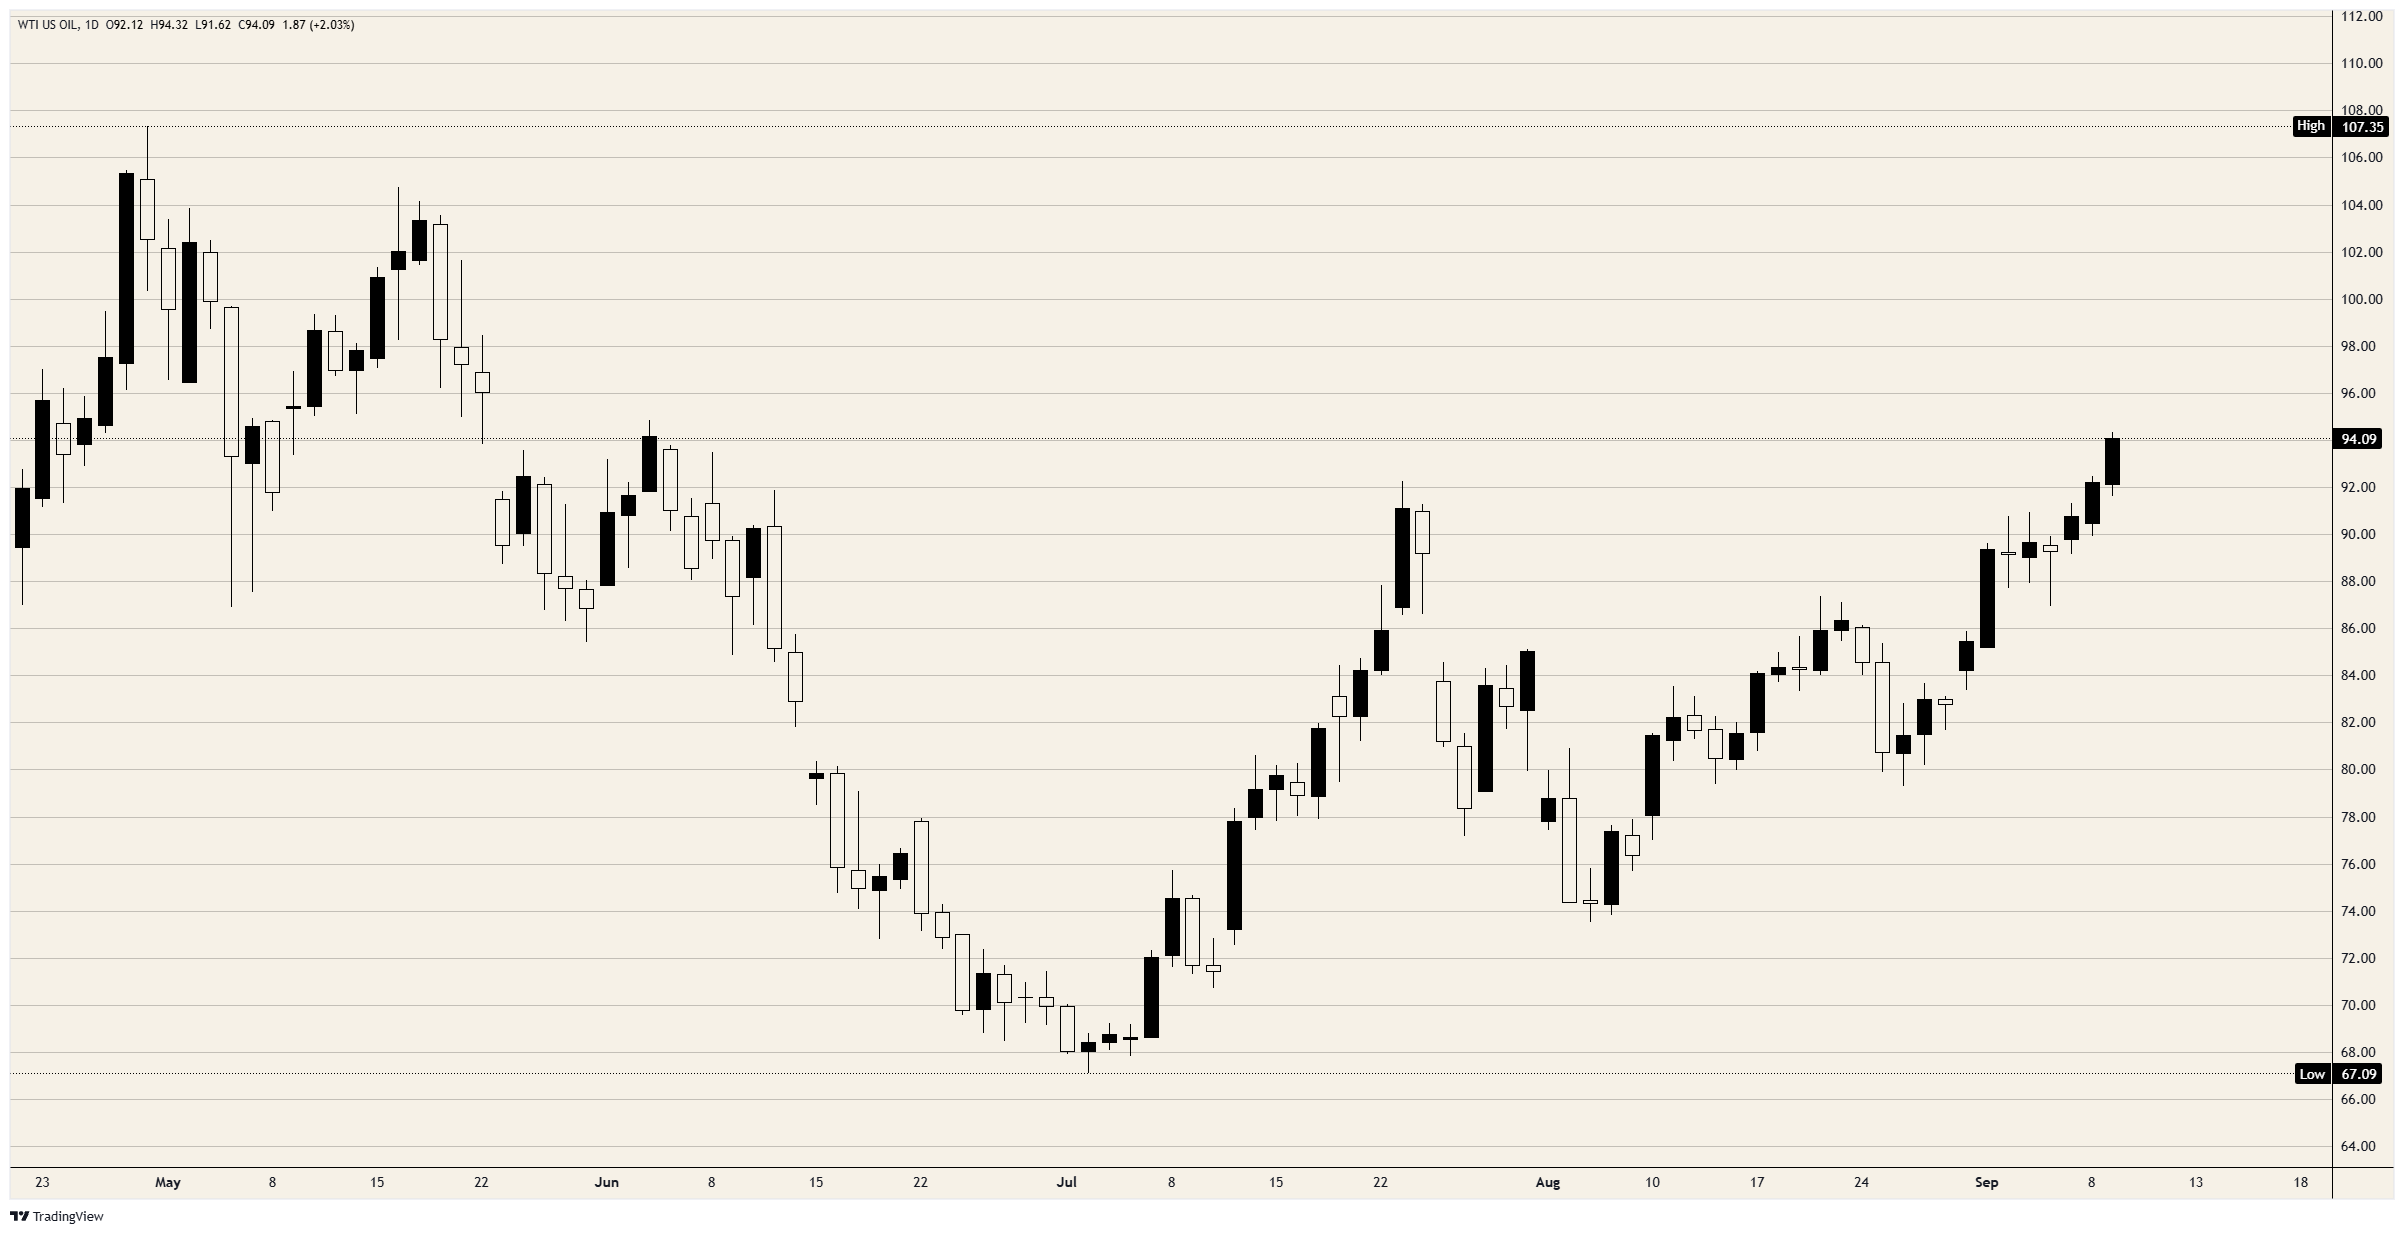
- WTI Crude Oil rallies hard above $94.00, up better than 2%, its best since May 22.
- Hormuz war-risk cover runs 7.5% to 12.5% of hull value, against 0.25% pre-war.
- Asian buyers took more than 40 million barrels of US Crude Oil for September.
West Texas Intermediate (WTI) settled just above $94.00, up better than 2% and at its best level since May 22. Iran's Revolutionary Guards said on Wednesday they had fired on two American vessels and eight tankers near the Strait of Hormuz, a day after United States forces destroyed five Iranian tankers in the Gulf of Oman and off Kharg Island. The market is paying up for a commodity nobody has stopped making.
Eighteen ships in five days and every wellhead still open
US Central Command put its Tuesday total at five vessels, four in the Gulf of Oman and one near Kharg Island, which brings the American tally to eight since Saturday. The Revolutionary Guards put their own count at ten on Wednesday. Britain's maritime security agency reported several merchant ships disabled on both sides of the strait, a vessel listing off Port Rashid and a gas carrier damaged at Khor Fakkan.
Tehran has promised a wider exclusion zone reaching the Arabian Sea off Chabahar, and it set its exchange rate in public: three Iranian targets struck will be answered with twenty. Crews were told to leave before the strikes landed, which is the one courtesy this war has kept.
Nobody is short of barrels, only of ships willing to fetch them
Additional war-risk cover for a Hormuz transit was last indicated at 7.5% to 12.5% of hull value, against roughly 0.25% before the conflict. Some underwriters have cut capacity and some have stopped quoting. Freight has moved with it. A supertanker on the Middle East Gulf to China route earned just under $704K a day last week, against just over $196K on the United States Gulf run to the same buyers.
Iraq's Basrah loadings show where the constraint sits. Exports recovered from roughly 1.35 million barrels a day in July to about 2.35 million in August once certain tankers were cleared to transit, and they remain beneath pre-war levels. The cargoes depend on a shrinking pool of vessels prepared to enter the Gulf at all.
Those are the same ships carrying the same cargo to the same refineries, and the only variable between them is one strait. Transits by commodity vessels have fallen to their lowest since May. May is also the month Crude Oil last traded up here. The two figures are the same figure.
Abu Dhabi pays higher barrel costs than Texas, delivered to the same refinery
Abu Dhabi's Murban grade loads outside the Strait of Hormuz, which is the whole of its advantage. It has been quoted above a $30.00 premium to Dubai for East Asian delivery, at least $10.00 more than the delivered cost of WTI shipped from the United States Gulf. Asian refiners have answered the way the arithmetic suggests, taking more than 40 million barrels of American Crude Oil for September loading against 22 million in August.
American refiners are running near record rates into the autumn and pump prices sit at a seasonal record, so every cargo bound for Asia tightens the barrel left behind. Saudi Arabia's observed exports have meanwhile dropped to the lowest in records going back to early 2017. The world's largest exporter is shipping less than at any point in nine years of data, in the middle of a rally in the thing it ships.
The inventory reports run late and the forecast ran early
The holiday pushed both inventory reports back a day. American Petroleum Institute (API) figures land at 20:30 GMT on Wednesday and the Energy Information Administration (EIA) report follows at 16:00 GMT on Thursday. US Producer Price Index (PPI) data arrives Thursday morning and August Consumer Price Index (CPI) at 12:30 GMT on Friday, headline consensus near 3.4% YoY. The energy component ran 14.7% YoY through July, so Friday's print is in part a reading of this chart, and it lands five days before the Federal Open Market Committee (FOMC) meets on September 15 and 16.
The EIA published its Short-Term Energy Outlook on Wednesday. It estimates global inventories down 400 million barrels so far this year, and it forecasts Brent to average around $90.00 through the second half on an assumption that Middle East flows gradually recover. Brent trades near $100.00. The document was completed on September 3.
Levels to watch
Resistance: The session high just short of $94.50 caps the move, with $95.00 the first round number above it. Beyond that sits the May 22 congestion between $95.00 and $98.50, the last block of supply beneath the $100.00 handle.
Support: The session low just above $91.50 is the first mark, with the $90.00 handle beneath it holding both the September 7 and September 8 lows. Further back, the $87.00 area carries the whole September advance.
Bias: Higher while $91.50 holds on the pullback, with $96.00 the first objective and $98.50 behind it. Momentum here is read from structure rather than an oscillator, and the ladder of higher lows since August 26 has broken once in eleven sessions. Invalidation is a daily close beneath $90.00. A reopening of Hormuz transit that insurers are willing to price does it faster than any chart level, and so does a hot CPI print that moves the FOMC.
WTI spot daily chart
WTI Oil FAQs
WTI Oil is a type of Crude Oil sold on international markets. The WTI stands for West Texas Intermediate, one of three major types including Brent and Dubai Crude. WTI is also referred to as “light” and “sweet” because of its relatively low gravity and sulfur content respectively. It is considered a high quality Oil that is easily refined. It is sourced in the United States and distributed via the Cushing hub, which is considered “The Pipeline Crossroads of the World”. It is a benchmark for the Oil market and WTI price is frequently quoted in the media.
Like all assets, supply and demand are the key drivers of WTI Oil price. As such, global growth can be a driver of increased demand and vice versa for weak global growth. Political instability, wars, and sanctions can disrupt supply and impact prices. The decisions of OPEC, a group of major Oil-producing countries, is another key driver of price. The value of the US Dollar influences the price of WTI Crude Oil, since Oil is predominantly traded in US Dollars, thus a weaker US Dollar can make Oil more affordable and vice versa.
The weekly Oil inventory reports published by the American Petroleum Institute (API) and the Energy Information Agency (EIA) impact the price of WTI Oil. Changes in inventories reflect fluctuating supply and demand. If the data shows a drop in inventories it can indicate increased demand, pushing up Oil price. Higher inventories can reflect increased supply, pushing down prices. API’s report is published every Tuesday and EIA’s the day after. Their results are usually similar, falling within 1% of each other 75% of the time. The EIA data is considered more reliable, since it is a government agency.
OPEC (Organization of the Petroleum Exporting Countries) is a group of 12 Oil-producing nations who collectively decide production quotas for member countries at twice-yearly meetings. Their decisions often impact WTI Oil prices. When OPEC decides to lower quotas, it can tighten supply, pushing up Oil prices. When OPEC increases production, it has the opposite effect. OPEC+ refers to an expanded group that includes ten extra non-OPEC members, the most notable of which is Russia.
Recommended Articles


