


Ripple Price Forecast: XRP eyes $1.40 breakout as bullish positions build
- XRP ticks up after defending $1.38 support amid increasing bullish derivatives positioning.
- The Open Interest Weighted Funding Rate remains in positive territory as OI steadies at 2.24 billion XRP.
- XRP sits above major moving averages, with momentum indicators supporting stability and a potential breakout.
Ripple (XRP) is grinding upward and getting closer to a short-term breakout above $1.40 on Tuesday. This uptick follows the remittance token's defense of support at $1.38, after a short-lived attempt to breach selling pressure at $1.50 last week.
Holding above $1.40 would reinforce the broader bullish outlook, while continued struggle below the same level would trigger an extended sell-off amid investor exhaustion.
XRP steadies as bulls increase long exposure
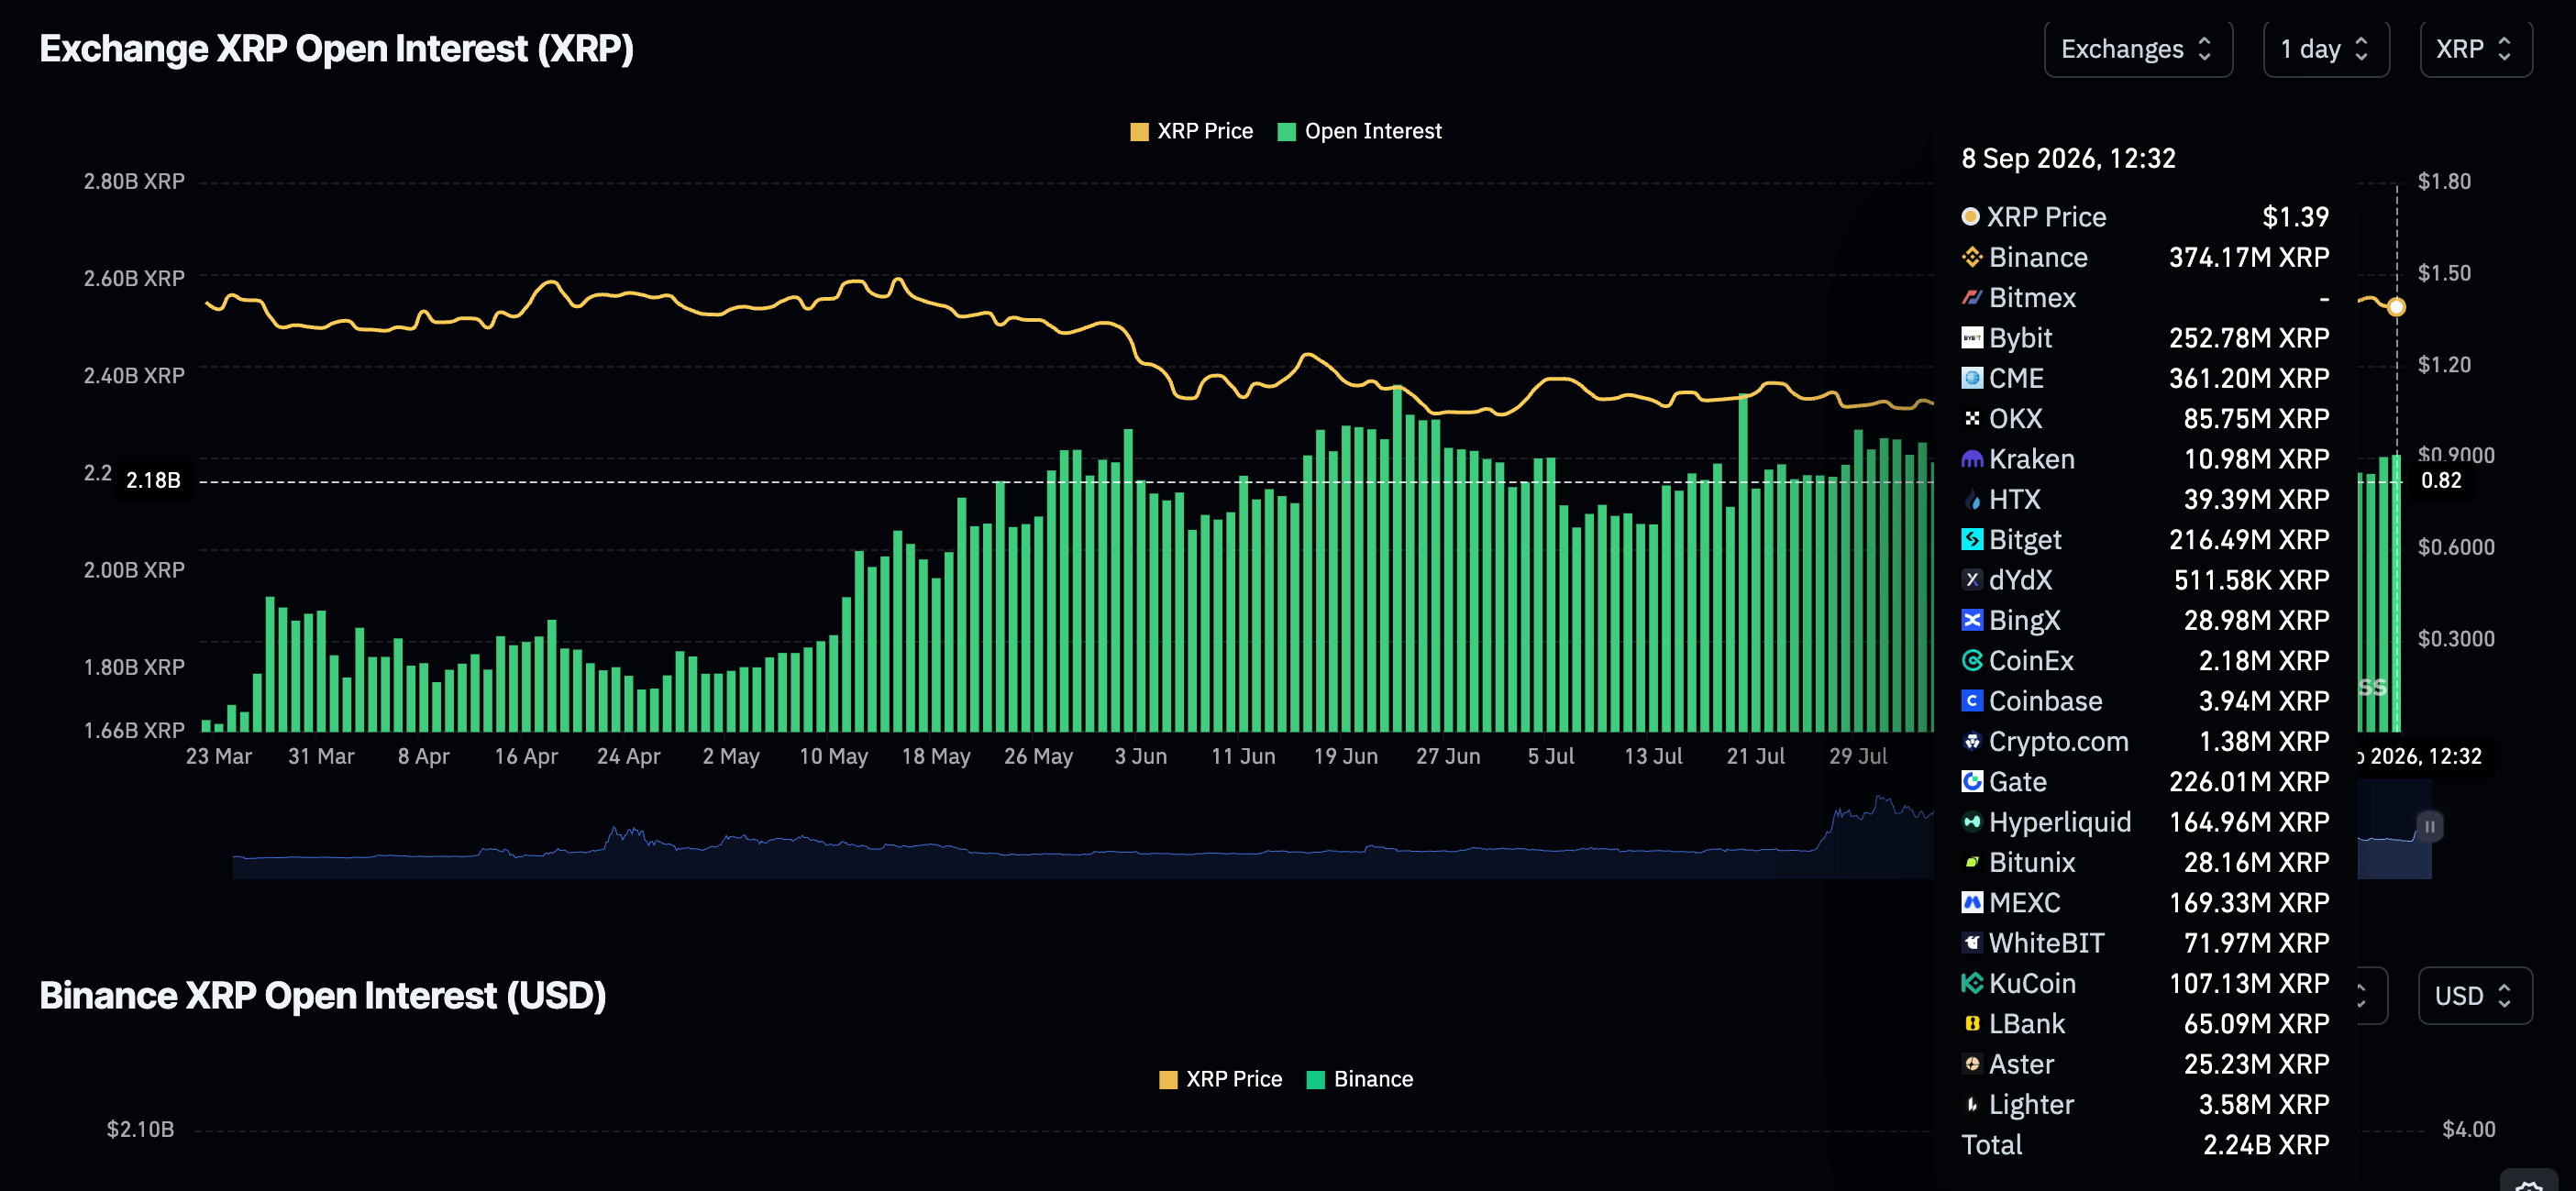
The XRP derivatives market is relatively stable on Tuesday, as reflected in perpetual futures Open Interest (OI) edging marginally higher at 2.24 billion XRP, from 2.23 billion XRP the day before and 2.2 billion XRP last Sunday. Looking back, OI has stabilized after falling from 2.78 billion XRP on August 15. If retail traders continue increasing exposure, they would help provide a tailwind to sustain the recovery above $1.40.
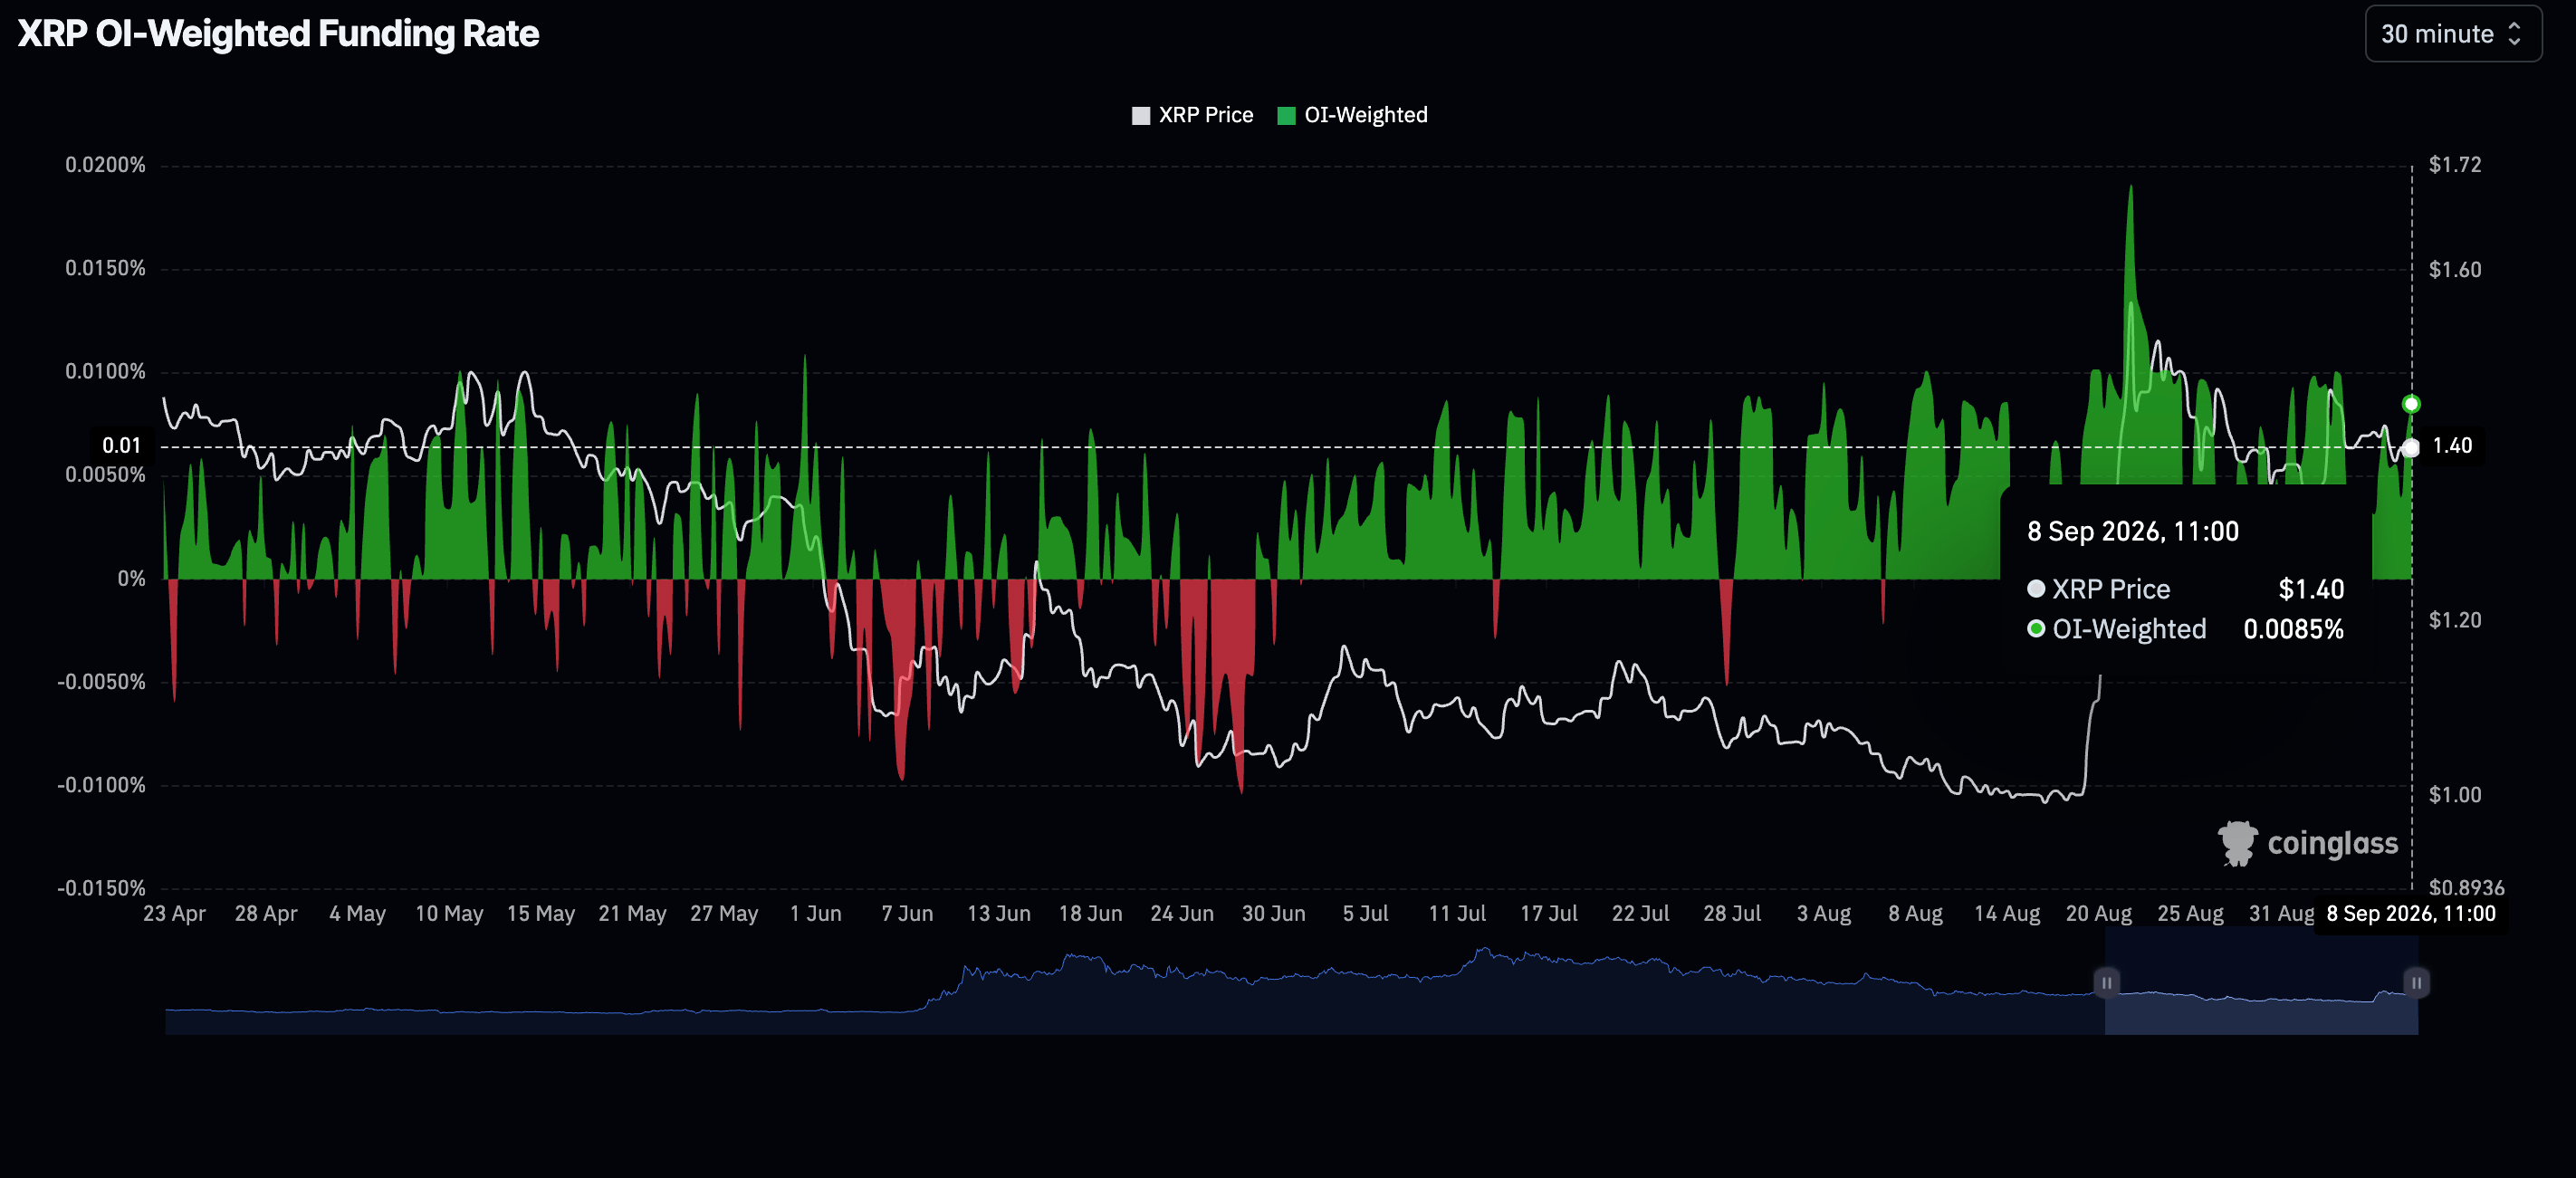
Meanwhile, bullish traders are increasing their risk exposure, with the OI-Weighted Funding Rate holding in positive territory at 0.01%. According to CoinGlass data, this metric has remained in this range since August 28, suggesting bulls have the upper hand and are willing to pay a premium to keep long positions open.
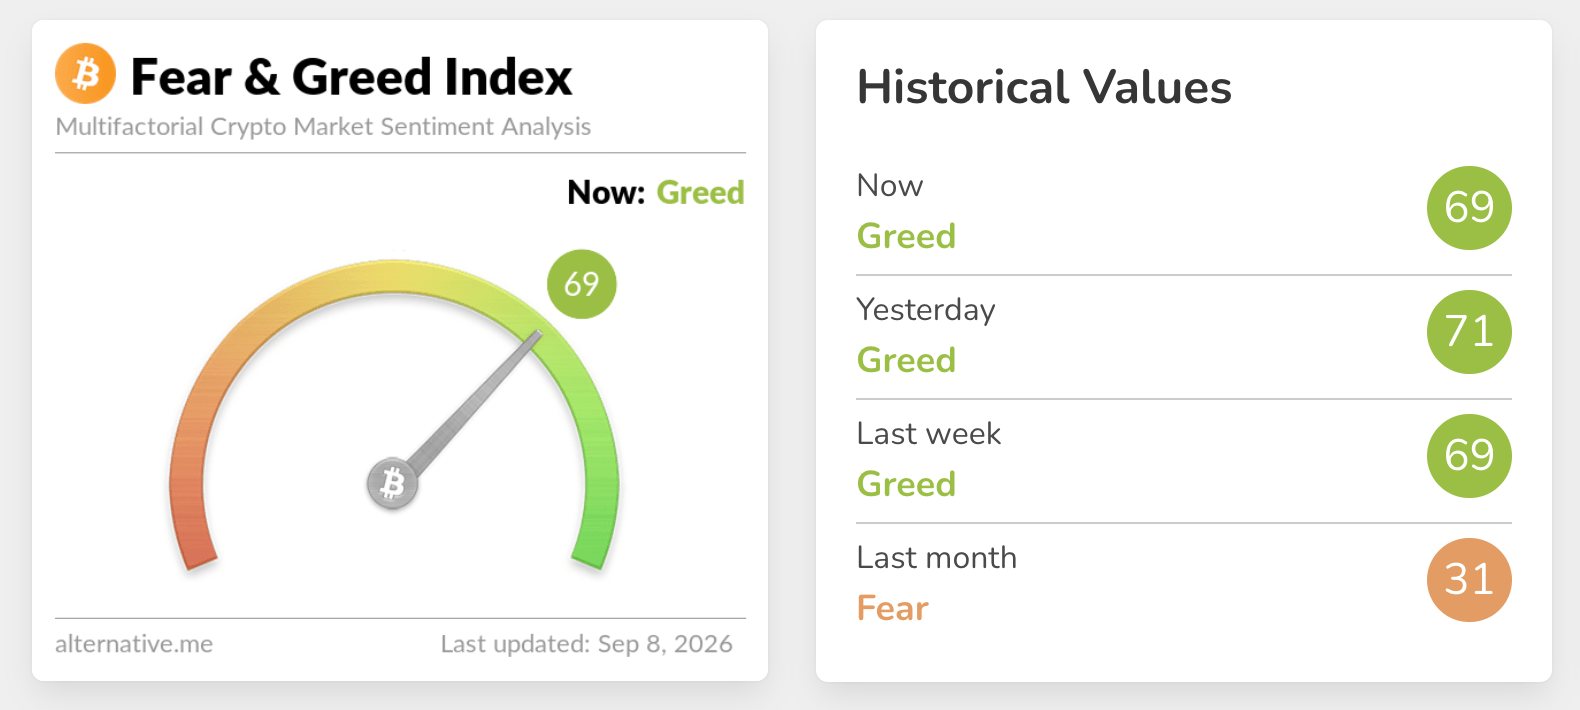
Moreover, appetite for risk assets in the broader cryptocurrency market sits in the Greed territory, according to the Fear & Greed Index. The index holds at 69 on Tuesday, down slightly from 71 the previous day. If this holds, the setup would continue to reinforce bullish positioning.
Technical analysis: XRP upholds bullish outlook
XRP trades near $1.40 after testing support at $1.38. The token maintains a constructive bullish bias as it consolidates above a stack of Exponential Moving Averages (EMAs), suggesting a broadly supported uptrend despite the latest pullback from recent highs.
The Relative Strength Index (RSI) near 59 hints at moderating but still positive momentum, while the Moving Average Convergence Divergence (MACD) has slipped modestly into negative territory, indicating that upside traction is softening rather than collapsing.
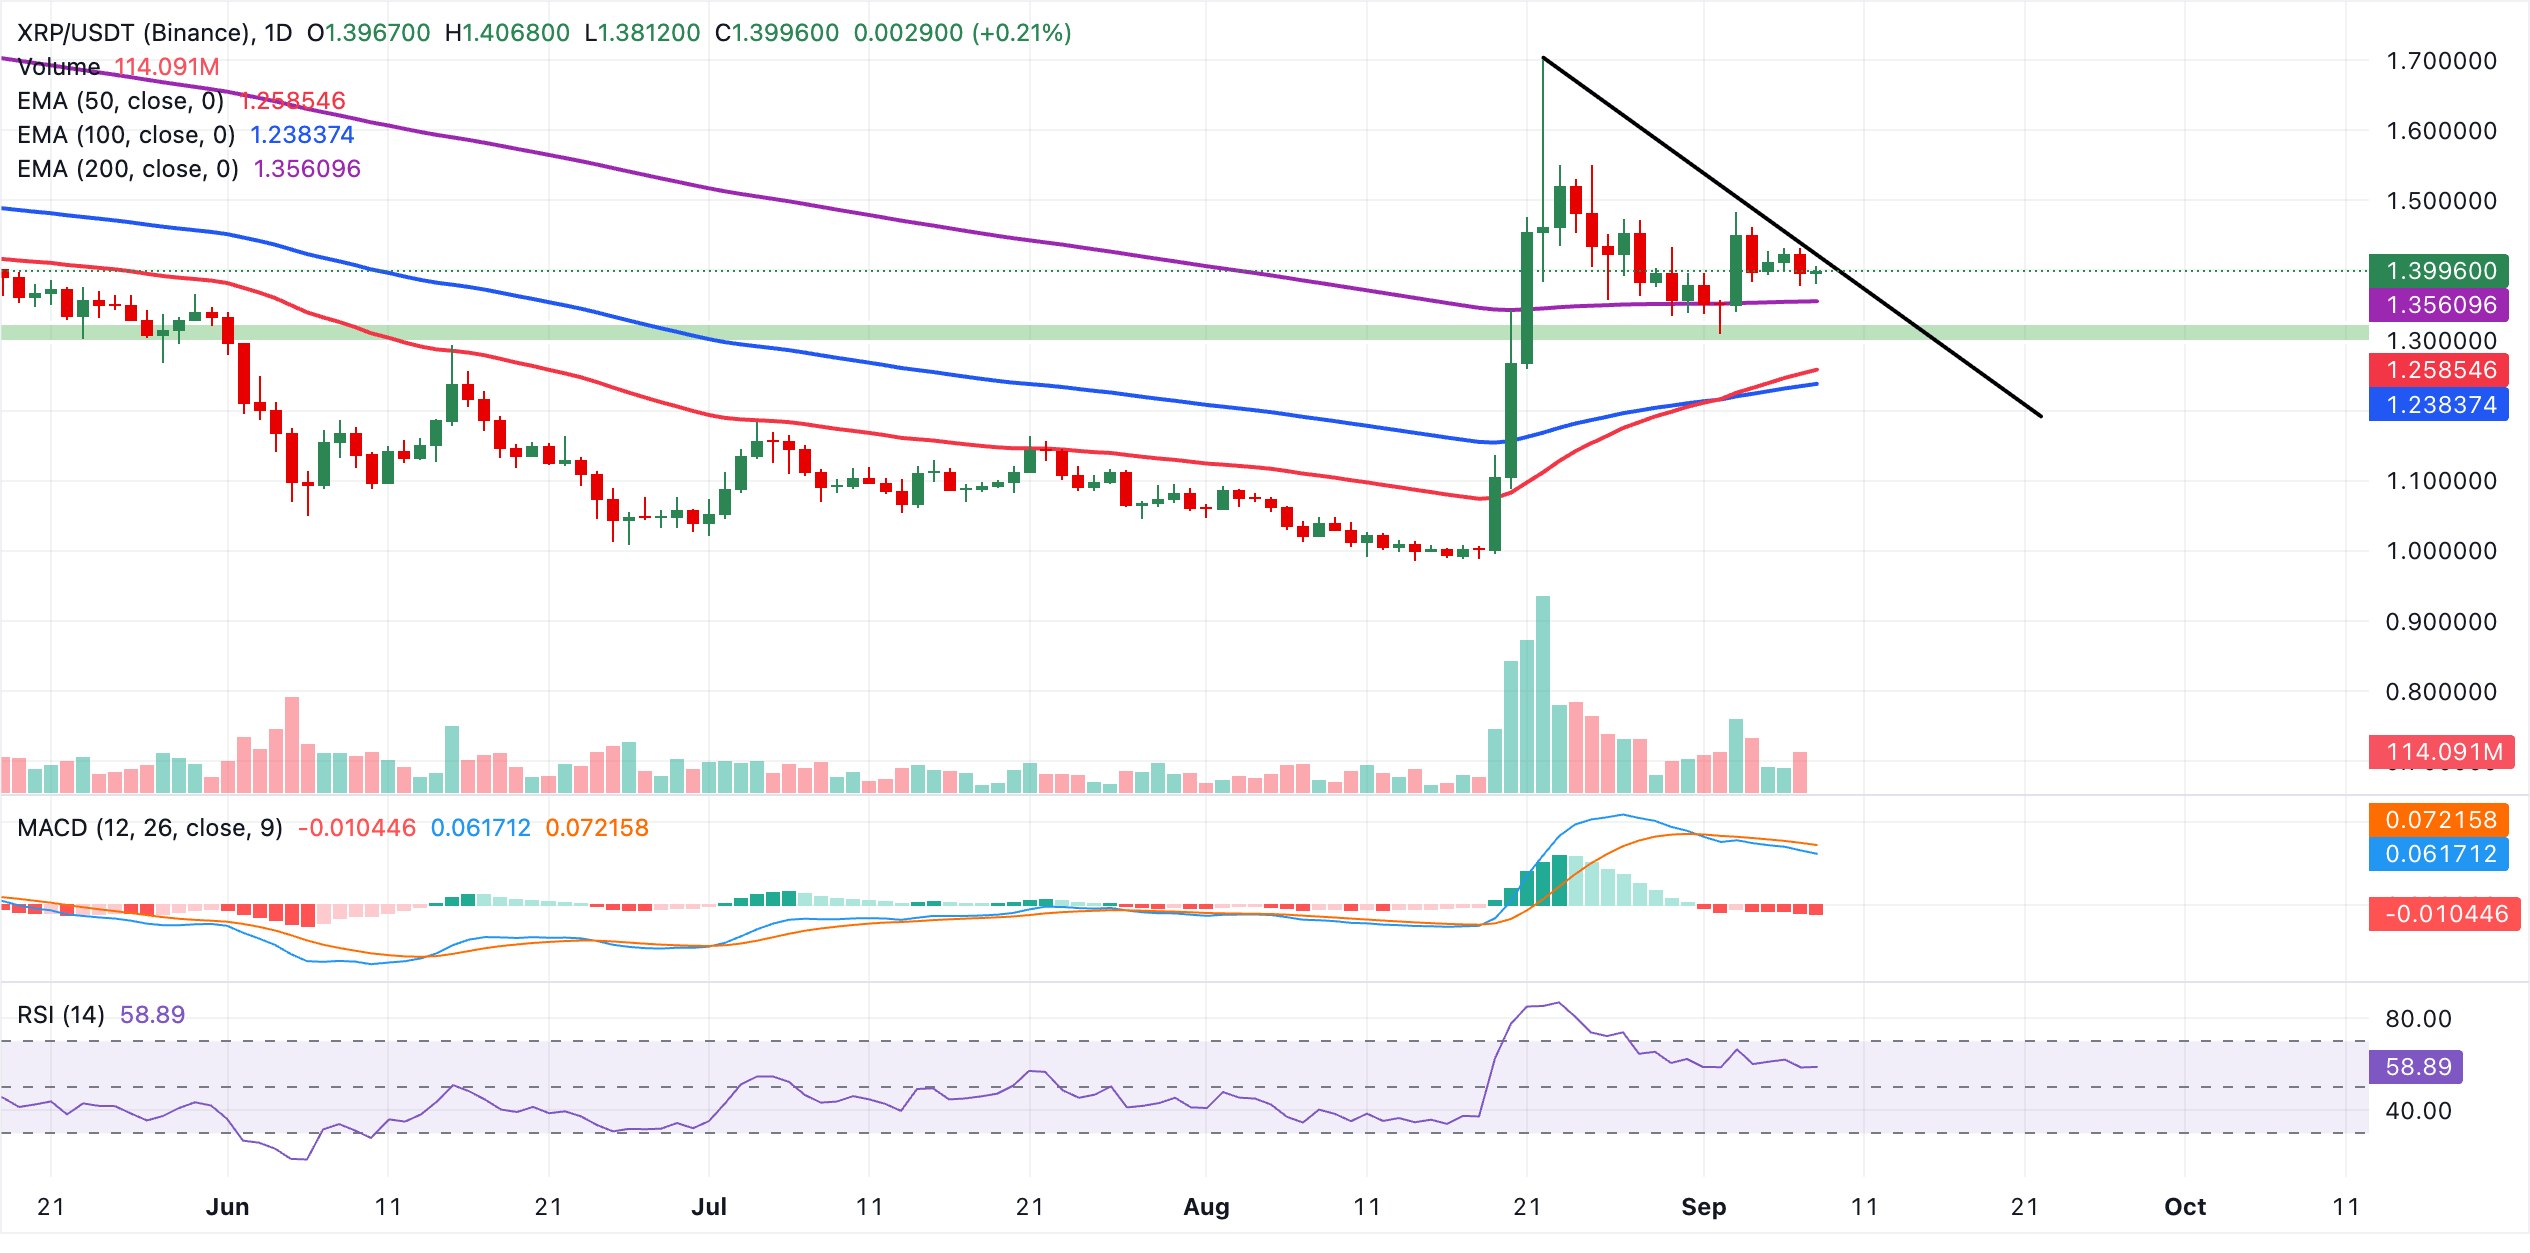
Initial resistance emerges at the descending trendline break area around $1.42, where a daily close above would reopen the path toward highs at $1.50 and $1.70, respectively. On the downside, immediate support is first at the 200-day EMA near $1.36, with further cushions at the 50-day EMA around $1.26 and the 100-day EMA near $1.24 if profit-taking deepens. As long as price holds above this EMA cluster, the broader bullish structure is likely to remain intact.
(The technical analysis of this story was written with the help of an AI tool. Know more.)
Open Interest, funding rate FAQs
Higher Open Interest is associated with higher liquidity and new capital inflow to the market. This is considered the equivalent of increase in efficiency and the ongoing trend continues. When Open Interest decreases, it is considered a sign of liquidation in the market, investors are leaving and the overall demand for an asset is on a decline, fueling a bearish sentiment among investors.
Funding fees bridge the difference between spot prices and prices of futures contracts of an asset by increasing liquidation risks faced by traders. A consistently high and positive funding rate implies there is a bullish sentiment among market participants and there is an expectation of a price hike. A consistently negative funding rate for an asset implies a bearish sentiment, indicating that traders expect the cryptocurrency’s price to fall and a bearish trend reversal is likely to occur.
Recommended Articles


