


Bitcoin outperforms global assets as $83K-$86K resistance zone continues to weigh on rally
- Bitcoin gained 23% over the past 21 days, outperforming major traditional assets, although it remains down roughly 10% year-to-date.
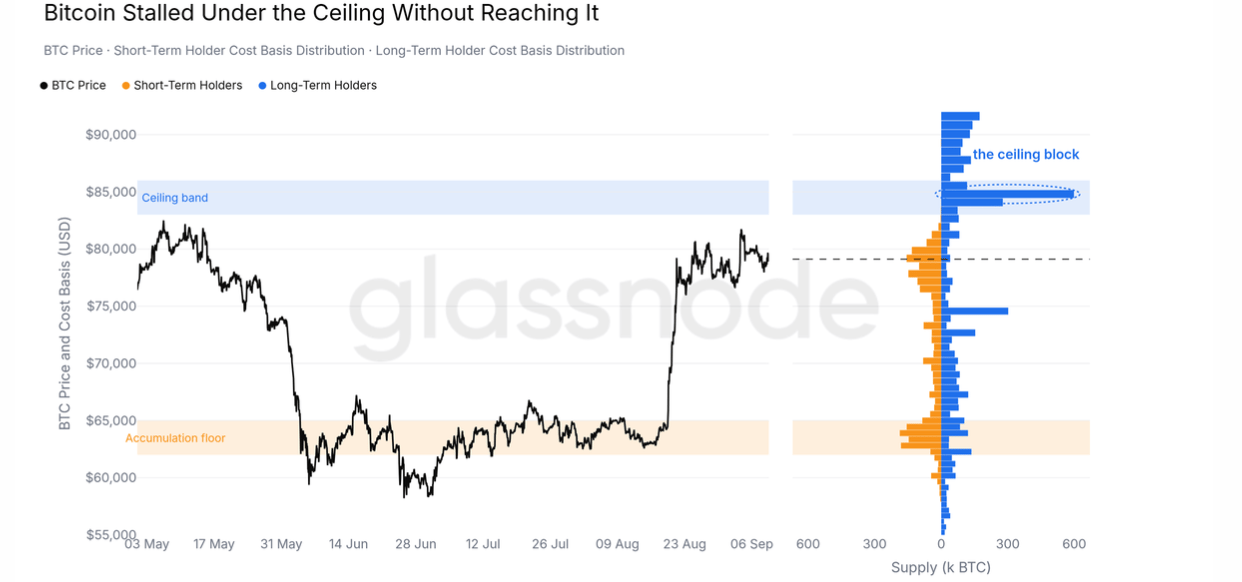
- Investors acquired roughly 1.07 million BTC between $83,000 and $86,000, creating a major resistance zone dominated by long-term holders.
- Altcoins' market cap rose 21% over the past month, although a broader rotation away from Bitcoin is yet to emerge.
Bitcoin (BTC) has continued to recover from its mid-year weakness, outperforming major traditional assets over the past month, amid strong resistance around the $83,000 to $86,000 range.
Bitcoin struggles against $86K resistance
BTC gained 23% over the past 21 trading sessions, while the S&P 500 and Nasdaq 100 were broadly flat and the Euro Stoxx 50 declined, according to a Glassnode report published Wednesday. The move puts Bitcoin at the top of the seven assets the analytics firm tracked over that period.
Despite outperforming major assets, Bitcoin's recent rally has struggled to break through the $83,000 to $86,000 resistance zone, which is the cost basis of most long-term holders (LTHs)
Glassnode's Long-Term Holder Cost Basis Distribution shows that investors acquired roughly 1.07 million BTC between $83,000 and $86,000, with most of those tokens held by long-term holders.
“Supply acquired between $76K and $82K, mostly by recent buyers, has grown while the $62K to $65K accumulation floor thinned as coins bought there rotated out,” Glassnode stated.
The report described the structure as a market that “rebuilt its floor directly under spot and left the ceiling intact.”
The derivatives market points to a similar barrier. The Bitcoin futures liquidation heatmap shows that short liquidation levels between $82,000 and $86,000 have increased 21% since the August 19 squeeze.
“A sustained move through $86K would consume the densest short-liquidation fuel on the map; a loss of $63K would begin to work through the long side,” Glassnode wrote.
Selling pressure remains muted near resistance
Despite Bitcoin nearing its resistance zone, selling pressure has remained relatively weak. The Sell-Side Risk Ratio has fallen to seven basis points per day on a seven-day basis, less than half the 16 basis points recorded at the August peak. At the July and October 2025 market highs, the measure reached 35 and 23 basis points, respectively.
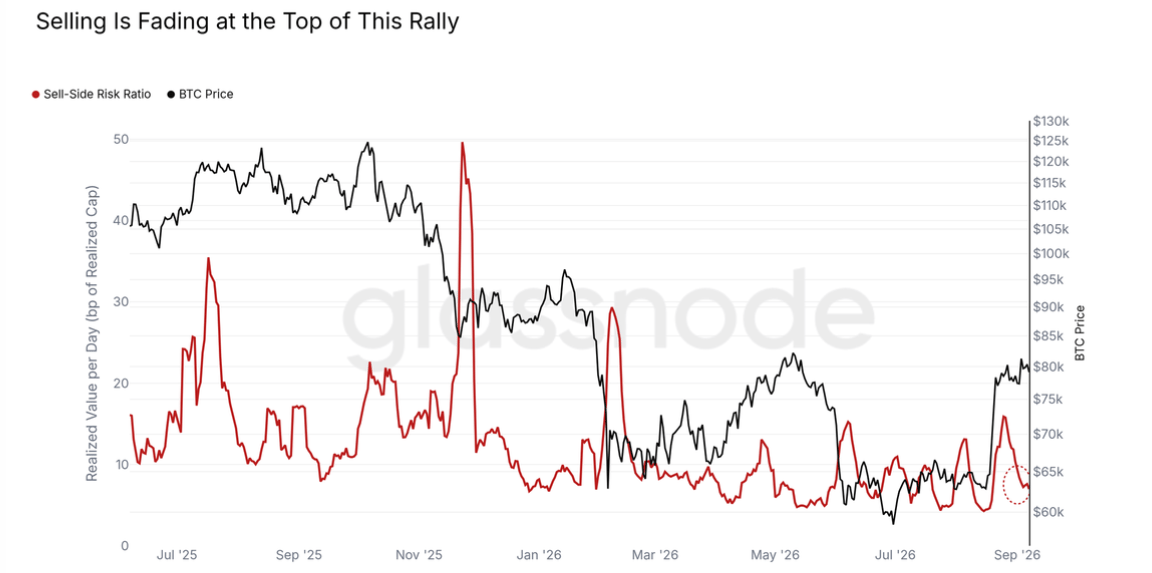
Long-term holders (LTH) accounted for 47% of realized profits, down from 88% during the August peak. The report also noted that the September 3 profit spike was less than half the size of August’s increase.
“The read is a market that has left its value zone without becoming expensive,” Glassnode added.
Altcoins have also risen, with total altcoin market capitalization increasing 21% over the past month. However, altcoins have not significantly gained market share against Bitcoin.
The 90-day change in altcoin share is currently negative at -0.9 percentage points. This suggests that the broad rotation into higher-risk assets typically seen near previous Bitcoin cycle peaks has yet to emerge.
BTC is trading at $78,400, down 0.1% in the past 24 hours at the time of writing.
Recommended Articles


