

NZD/USD Price Forecast: SMA cluster wobbles as US yields bite

Source Fxstreet
  • NZD/USD trades below SMA cluster as consolidation deepens.
  • Bearish RSI points to downside while trendline support nears.
  • Break below 0.5800 exposes 0.5761 and 0.5700 next.

The New Zealand Dollar extends its losses against the US Dollar, down 0.30% as the Greenback gets underpinned by rising US Treasury yields, with the 10-year reaching its highest level since 2023. The NZD/USD trades at 0.5835.

NZD/USD Price Forecast: Technical Outlook

Price action shows the NZD/USD pair is poised to consolidate further, within familiar levels, with the exchange rate seesawing around the confluence of the 50-, 100- and 200-day Simple Moving Averages (SMAs), each at around 0.5848. 0.5843 and 0.5854, respectively.

However, from a momentum standpoint, further downside is seen as the Relative Strength Index (RSI) turned bearish.

On the downside, the NZD/USD first line of defense is a support trendline passing through around 0.5810-0.5820. Once cleared, the 0.5800 figure emerges as the next support level. A breach of the latter, and of NZD/USD, could extend its losses towards the July 29 swing low of 0.5761, before printing a leg lower to the 0.5700 mark.

Meanwhile, for a bullish reversal, NZD/USD must climb above the SMA confluence. Once done, the next resistance is the September 4 high of the day (HOD) at 0.5903. Up next lies the psychological 0.5950 and 0.6000.

NZD/USD Price Chart – Daily
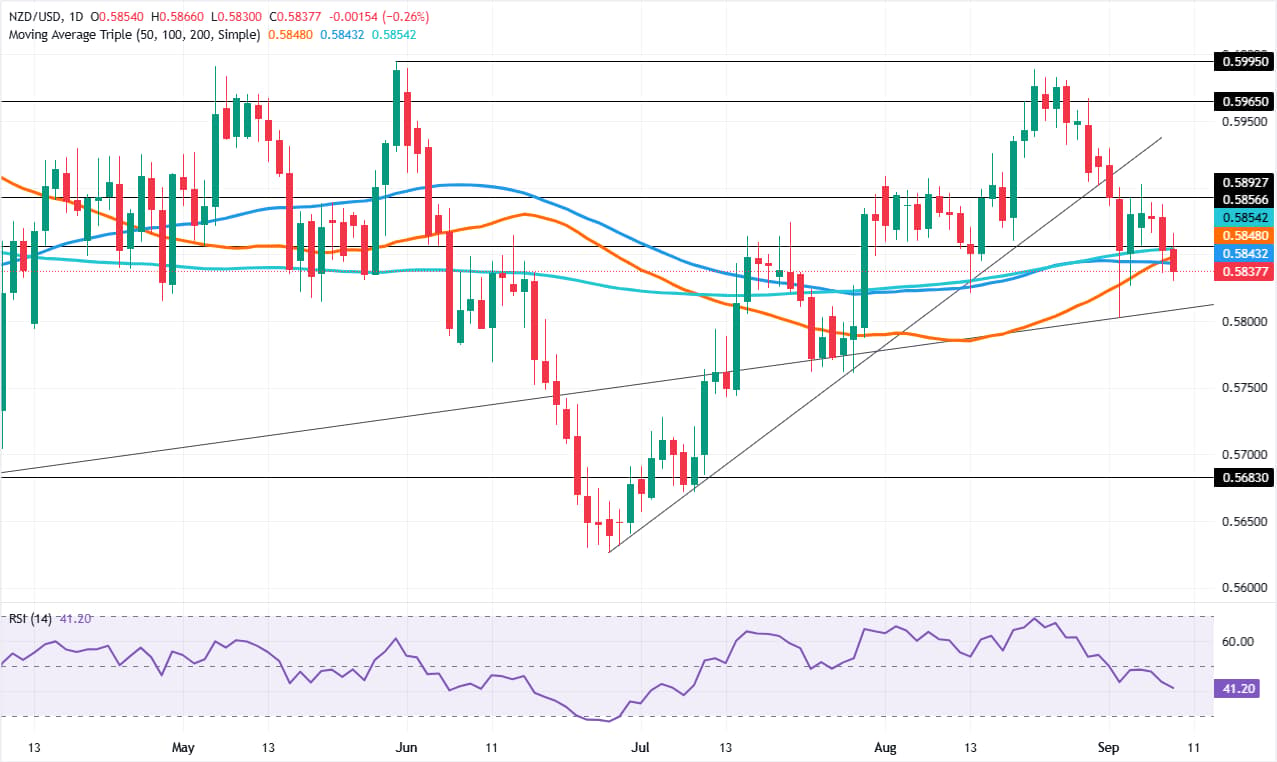
NZD/USD daily chart

New Zealand Dollar Price Today

The table below shows the percentage change of New Zealand Dollar (NZD) against listed major currencies today. New Zealand Dollar was the strongest against the Canadian Dollar.

USD EUR GBP JPY CAD AUD NZD CHF
USD -0.05% -0.03% -0.25% 0.18% 0.00% 0.26% 0.10%
EUR 0.05% 0.05% -0.20% 0.23% 0.05% 0.33% 0.16%
GBP 0.03% -0.05% -0.21% 0.21% 0.04% 0.30% 0.15%
JPY 0.25% 0.20% 0.21% 0.43% 0.24% 0.50% 0.35%
CAD -0.18% -0.23% -0.21% -0.43% -0.18% 0.09% -0.07%
AUD -0.00% -0.05% -0.04% -0.24% 0.18% 0.27% 0.12%
NZD -0.26% -0.33% -0.30% -0.50% -0.09% -0.27% -0.18%
CHF -0.10% -0.16% -0.15% -0.35% 0.07% -0.12% 0.18%

The heat map shows percentage changes of major currencies against each other. The base currency is picked from the left column, while the quote currency is picked from the top row. For example, if you pick the New Zealand Dollar from the left column and move along the horizontal line to the US Dollar, the percentage change displayed in the box will represent NZD (base)/USD (quote).

Disclaimer: For information purposes only. Past performance is not indicative of future results.
placeholder
Gold Price Analysis Today: Gold Rebounds After 1.91% Drop as Yields Ease. Is $4,449 Next? Gold fell about 1.91% on August 18 before producing a strong bullish reaction from the 1-hour demand zone in early August 19 trading. RSI is recovering from oversold conditions, but Supertrend remains bearish as traders await the Fed minutes.
Author  Naoufal Seddik
Aug 19, Wed
Gold fell about 1.91% on August 18 before producing a strong bullish reaction from the 1-hour demand zone in early August 19 trading. RSI is recovering from oversold conditions, but Supertrend remains bearish as traders await the Fed minutes.
placeholder
Gold Price Analysis Today: Gold Gains 0.94% as Markets Expect Fed to Hold Rates, Can $4,449 Resistance Break? Gold gained 0.94% on August 17, closing near $4,417.30 as softer US data strengthened expectations for unchanged Fed rates in September. Gold remains bullish, with $4,449.730 resistance and $4,310.650 support in focus.
Author  Naoufal Seddik
Aug 18, Tue
Gold gained 0.94% on August 17, closing near $4,417.30 as softer US data strengthened expectations for unchanged Fed rates in September. Gold remains bullish, with $4,449.730 resistance and $4,310.650 support in focus.
placeholder
Gold Price Analysis Today: Gold Drops 1.32% Despite Lower Fed Rate-Hike Bets, Can $4,313 Support Hold? Gold fell 1.32% on August 13 after rising to $4,449.73, then reversing lower and closing near $4,349.918 below the $4,356.46 support. Softer US inflation data reduced Fed rate hike expectations, but selling pressure still dominated the session. Will $4,313 support hold?
Author  Naoufal Seddik
Aug 14, Fri
Gold fell 1.32% on August 13 after rising to $4,449.73, then reversing lower and closing near $4,349.918 below the $4,356.46 support. Softer US inflation data reduced Fed rate hike expectations, but selling pressure still dominated the session. Will $4,313 support hold?
placeholder
XAUUSD Gold Analysis: Gold Holds Above $4,350 Ahead of US Inflation Data Is $4,500 Next? Gold holds above $4,350 following weak US jobs data. As inflation reports approach and UBS eyes $5,000, can XAUUSD break resistance at $4,435 to rally toward $4,500?
Author  Naoufal Seddik
Aug 12, Wed
Gold holds above $4,350 following weak US jobs data. As inflation reports approach and UBS eyes $5,000, can XAUUSD break resistance at $4,435 to rally toward $4,500?
placeholder
Intel Price Forecast: Nvidia Picked Xeon 6, Invested $5B, Yet Analysts Still Trail INTCIntel Corporation (NASDAQ: INTC) sits at $140.05, holding firm on the ascending trendline within the 2H timeframe. The RSI indicator is currently reading 55.21, positioning it as neutral-
Author  TradingKey
Jul 02, Thu
Intel Corporation (NASDAQ: INTC) sits at $140.05, holding firm on the ascending trendline within the 2H timeframe. The RSI indicator is currently reading 55.21, positioning it as neutral-
Related Instrument
goTop
quote