


GBP/JPY Price Forecast: Oversold conditions help buyers regain ground
- GBP/JPY rebounds on Tuesday as the Japanese Yen’s recent rally loses momentum.
- Oversold RSI conditions support the recovery, but the cross stays below the 50-day, 100-day and 200-day SMAs.
- The 210 mark provides immediate resistance, while support is seen at 207.10 and 205.
GBP/JPY rebounds on Tuesday as the Japanese Yen (JPY) loses momentum following its sharp rise since the start of the month. At the time of writing, the cross trades around 208.90 after briefly falling to 207.10, its lowest level since December 2025.
Some profit-taking in the Yen, combined with oversold Relative Strength Index (RSI) conditions in GBP/JPY, appears to be helping the cross rebound on Tuesday. Higher Oil prices also add pressure on the Japanese currency. Japan relies heavily on imported energy, particularly from the Middle East.
The Yen’s recent rally has been driven by expectations that the Bank of Japan (BoJ) will speed up its monetary policy tightening, prompting traders to unwind Yen-funded carry trades and bring capital back to Japan.
Better-than-initially-estimated Japanese Gross Domestic Product (GDP) data released earlier in the day reinforced expectations of a BoJ rate increase but provided little support to the Yen. The central bank is widely expected to raise interest rates at its September 17-18 meeting.
On the UK side, the Bank of England (BoE) is expected to leave interest rates unchanged for a sixth consecutive meeting on September 17. Attention now turns to the BoE Monetary Policy Report hearing later on Tuesday. Governor Andrew Bailey and other Monetary Policy Committee members will testify before lawmakers and traders will look for fresh clues about the interest rate path.
Technical Analysis
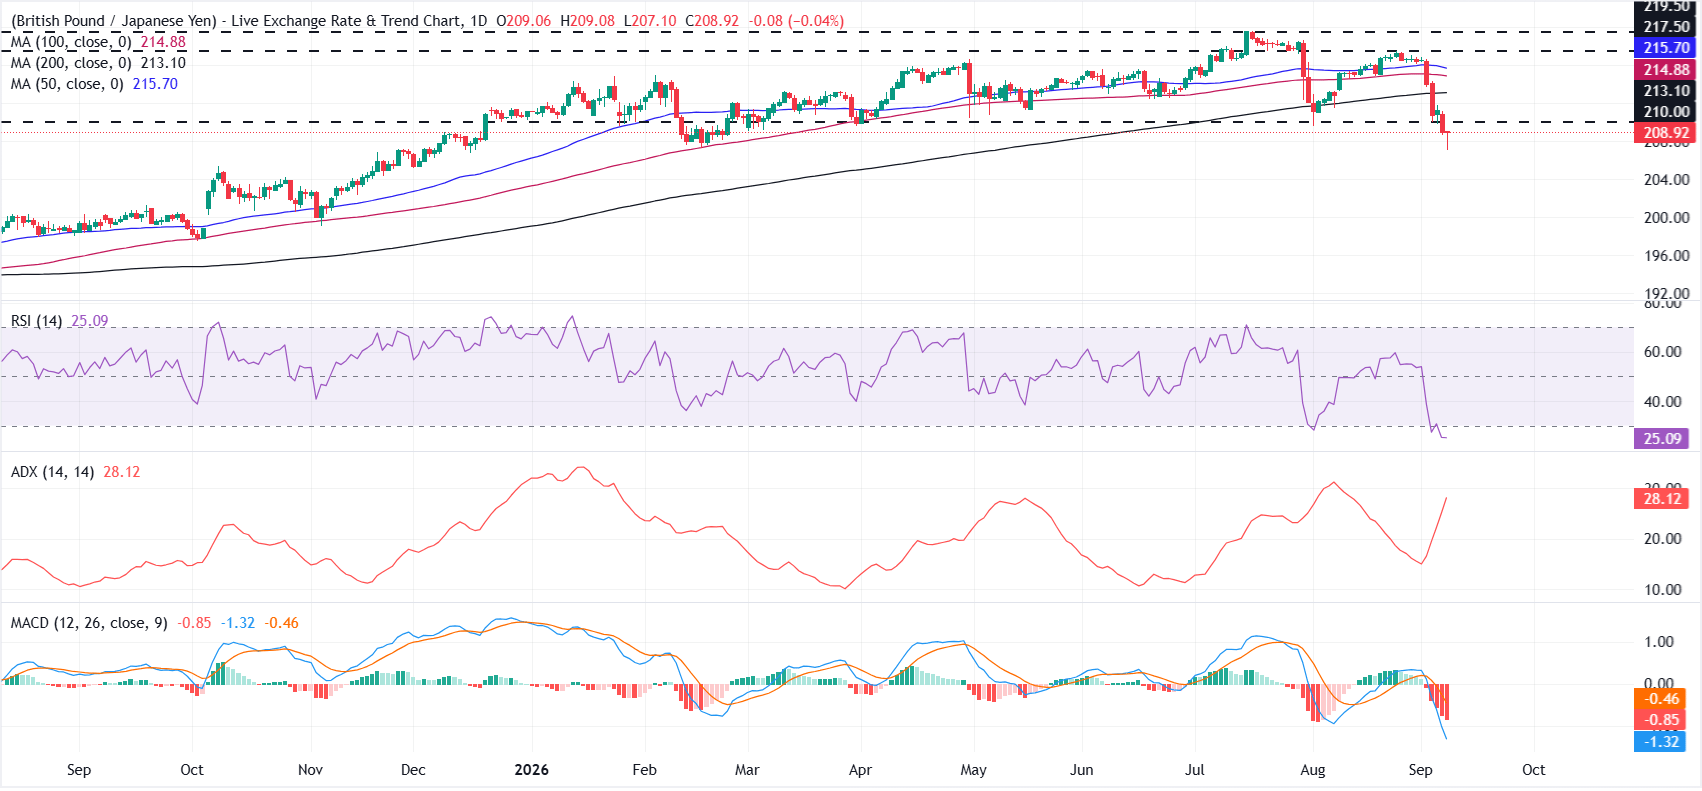
On the daily chart, GBP/JPY keeps its bearish near-term bias as it trades below the 50-day, 100-day and 200-day simple moving averages (SMAs). However, the Relative Strength Index (RSI) near 25 indicates oversold conditions and helps explain Tuesday’s corrective rebound. The Moving Average Convergence Divergence (MACD) stays below zero, while the Average Directional Index (ADX) rises toward 28, suggesting the broader downtrend remains strong.
On the upside, the psychological 210 mark acts as immediate resistance. A break above this level could open the door toward the 200-day SMA at 213, followed by the 100-day SMA at 214. Further resistance is seen at 217.50 and 219.50.
On the downside, Tuesday’s low near 207.10 provides immediate support. A break below this level could expose the psychological 205.00 mark. Buyers would need to push GBP/JPY firmly above the 210.00-215.00 region to ease the bearish pressure and support a stronger recovery.
(The technical analysis of this story was written with the help of an AI tool. Know more.)
Japanese Yen Price Today
The table below shows the percentage change of Japanese Yen (JPY) against listed major currencies today. Japanese Yen was the strongest against the New Zealand Dollar.
| USD | EUR | GBP | JPY | CAD | AUD | NZD | CHF | |
|---|---|---|---|---|---|---|---|---|
| USD | 0.09% | -0.01% | -0.03% | -0.07% | 0.08% | 0.63% | 0.26% | |
| EUR | -0.09% | -0.10% | -0.07% | -0.11% | -0.02% | 0.54% | 0.17% | |
| GBP | 0.00% | 0.10% | 0.00% | -0.07% | 0.07% | 0.63% | 0.28% | |
| JPY | 0.03% | 0.07% | 0.00% | -0.05% | 0.10% | 0.66% | 0.30% | |
| CAD | 0.07% | 0.11% | 0.07% | 0.05% | 0.14% | 0.70% | 0.35% | |
| AUD | -0.08% | 0.02% | -0.07% | -0.10% | -0.14% | 0.58% | 0.20% | |
| NZD | -0.63% | -0.54% | -0.63% | -0.66% | -0.70% | -0.58% | -0.36% | |
| CHF | -0.26% | -0.17% | -0.28% | -0.30% | -0.35% | -0.20% | 0.36% |
The heat map shows percentage changes of major currencies against each other. The base currency is picked from the left column, while the quote currency is picked from the top row. For example, if you pick the Japanese Yen from the left column and move along the horizontal line to the US Dollar, the percentage change displayed in the box will represent JPY (base)/USD (quote).
Recommended Articles


