


US Dollar Index Price Forecast: Stabilizes below 61.8% Fibo retracement at 99.20
- The US Dollar bounces back and turns slightly positive to near 98.95.
- Strong US NFP data has boosted hawkish Fed prospects.
- Investors keenly await the US PPI and CPI data for August.
The US Dollar (USD) recovers its early losses and turns marginally positive during the European trading session on Tuesday. At press time, the US Dollar Index (DXY), which gauges the Greenback’s value against six major currencies, trades marginally higher to near 98.95.
US Dollar Price Today
The table below shows the percentage change of US Dollar (USD) against listed major currencies today. US Dollar was the strongest against the New Zealand Dollar.
| USD | EUR | GBP | JPY | CAD | AUD | NZD | CHF | |
|---|---|---|---|---|---|---|---|---|
| USD | 0.07% | 0.08% | -0.32% | -0.12% | 0.12% | 0.56% | 0.15% | |
| EUR | -0.07% | 0.00% | -0.39% | -0.19% | 0.03% | 0.49% | 0.07% | |
| GBP | -0.08% | -0.00% | -0.42% | -0.20% | 0.03% | 0.50% | 0.08% | |
| JPY | 0.32% | 0.39% | 0.42% | 0.24% | 0.47% | 0.94% | 0.51% | |
| CAD | 0.12% | 0.19% | 0.20% | -0.24% | 0.23% | 0.69% | 0.28% | |
| AUD | -0.12% | -0.03% | -0.03% | -0.47% | -0.23% | 0.47% | 0.05% | |
| NZD | -0.56% | -0.49% | -0.50% | -0.94% | -0.69% | -0.47% | -0.41% | |
| CHF | -0.15% | -0.07% | -0.08% | -0.51% | -0.28% | -0.05% | 0.41% |
The heat map shows percentage changes of major currencies against each other. The base currency is picked from the left column, while the quote currency is picked from the top row. For example, if you pick the US Dollar from the left column and move along the horizontal line to the Japanese Yen, the percentage change displayed in the box will represent USD (base)/JPY (quote).
Broadly, the US Dollar is under pressure even as traders have raised hawkish Federal Reserve (Fed) expectations after the upbeat United States (US) Nonfarm Payrolls (NFP) data release on Friday.
Commerzbank wrote in a note that the stronger-than-expected US employment report revived expectations for a September Fed rate hike. They highlight that “the Fed funds futures increased the probability of a 25bp hike on 16 September to 62% compared with 51% before the employment report”.
This week, major triggers for the US Dollar will be the US Producer Price Index (PPI) and the Consumer Price Index (CPI) data for August, which will be released on Thursday and Friday, respectively.
Analysts at Deutsche Bank stress that “all eyes will be on the August US CPI print on Friday, preceded by the PPI on Thursday,” noting that these releases represent “the last set of inflation readings before the Fed’s next decision on September 16.” Their US economists expect a notable pickup in price pressures, with August’s headline CPI forecast “to come in at +0.38% MoM vs. +0.07% previously,” while they see underlying pressures remaining contained as core CPI is projected “to print +0.21% vs. +0.22%.”
US Dollar Index Technical Analysis
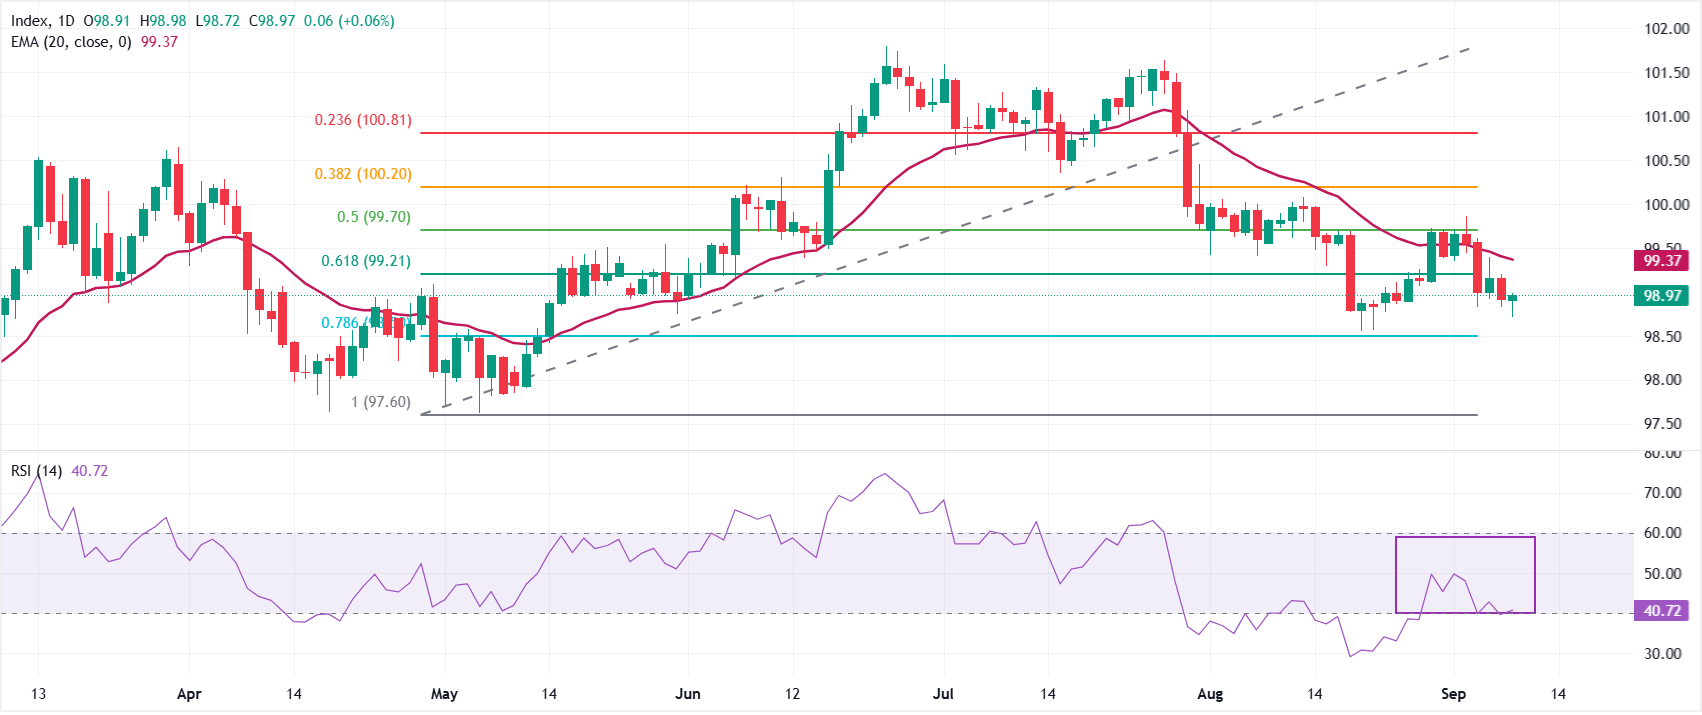
In the daily chart, the Dollar Index Spot trades at 98.97, keeping a bearish near-term bias as it holds below the 20-day Exponential Moving Average (EMA) at 99.37 and the 61.8% Fibonacci retracement at 99.21.
The Relative Strength Index (14) near 41 stays under the neutral 50 line, hinting at subdued upside momentum while the index consolidates beneath this overhead cluster of resistance levels.
On the topside, initial resistance emerges at 99.21 from the 61.8% retracement, followed by the 20-day EMA at 99.37 and the 50% retracement at 99.70; further advances would target 100.20 and 100.81 as higher Fibonacci barriers. On the downside, immediate support is seen at the 78.6% retracement around 98.50, with a deeper floor at the prior swing low and 100% retracement near 97.60, where buyers may attempt to slow any extension of the decline.
(The technical analysis of this story was written with the help of an AI tool. Know more.)
Economic Indicator
Nonfarm Payrolls
The Nonfarm Payrolls release presents the number of new jobs created in the US during the previous month in all non-agricultural businesses; it is released by the US Bureau of Labor Statistics (BLS). The monthly changes in payrolls can be extremely volatile. The number is also subject to strong reviews, which can also trigger volatility in the Forex board. Generally speaking, a high reading is seen as bullish for the US Dollar (USD), while a low reading is seen as bearish, although previous months' reviews and the Unemployment Rate are as relevant as the headline figure. The market's reaction, therefore, depends on how the market assesses all the data contained in the BLS report as a whole.
Read more.Last release: Fri Sep 04, 2026 12:30
Frequency: Monthly
Actual: 162K
Consensus: 56K
Previous: -23K
Source: US Bureau of Labor Statistics
America’s monthly jobs report is considered the most important economic indicator for forex traders. Released on the first Friday following the reported month, the change in the number of positions is closely correlated with the overall performance of the economy and is monitored by policymakers. Full employment is one of the Federal Reserve’s mandates and it considers developments in the labor market when setting its policies, thus impacting currencies. Despite several leading indicators shaping estimates, Nonfarm Payrolls tend to surprise markets and trigger substantial volatility. Actual figures beating the consensus tend to be USD bullish.
Recommended Articles


