


XRP (XRPUSD) Is up 1.01% on Oct 10: Key Drivers to Watch
XRP (XRPUSD) is up 1.01% at Oct 10 21:40(ET), now at $1.4033, with a 7-day down of 5.81%.
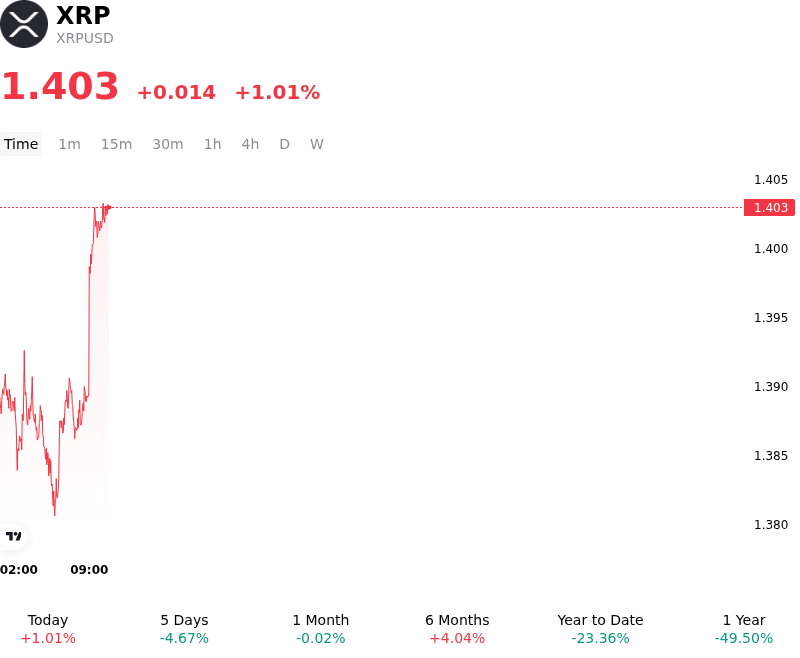
What is driving XRP (XRPUSD)’s stock price up today?
The modest upward momentum in XRP reflects persistent institutional spot accumulation alongside supply-side tightening across centralized exchanges. Sustained net inflows into spot XRP exchange-traded funds have provided a consistent underlying bid, helping buffer the asset against recent broader market volatility and leverage resets. Institutional investors continue to deploy capital through regulated vehicle structures, treating price dips as strategic accumulation opportunities. Simultaneously, on-chain analytics highlight continued whale-tier withdrawals from major trading venues, gradually reducing available sell-side liquidity on order books and tightening float dynamics.
Sentiment was further bolstered by developments in institutional custody infrastructure and corporate treasury adoption. The integration of XRP into institutional brokerage and custody offerings by major trust entities, alongside expanding enterprise partnerships, has reinforced long-term adoption expectations for cross-border payment and settlement infrastructure. Additionally, progress surrounding specialized corporate treasury entities holding substantial XRP balances on balance sheets has introduced structural demand tailwinds, reassuring institutional market participants of expanding utility within corporate finance frameworks.
From a market structure perspective, the move follows a stabilization in derivatives positioning after a brief period of forced long liquidations. As excess leverage was flushed out, futures funding rates normalized and spot-driven buying stepped in around key technical support levels. On-chain developments on the XRP Ledger, including the deployment of protocol upgrades aimed at enhancing account delegation and transaction efficiency, have provided additional fundamental backing by demonstrating steady network development.
Looking ahead, global macroeconomic conditions and benchmark bond yields remain important swing factors for broader risk assets. While elevated U.S. Treasury yields continue to exert pressure on high-beta asset valuations, XRP's resilient institutional ETF demand and contracting exchange inventory position the token constructively. Institutional market participants will continue to track daily fund flows, treasury activity, and incoming Federal Reserve policy guidance to evaluate the sustainability of current capital inflows.
Technical Analysis of XRP (XRPUSD)
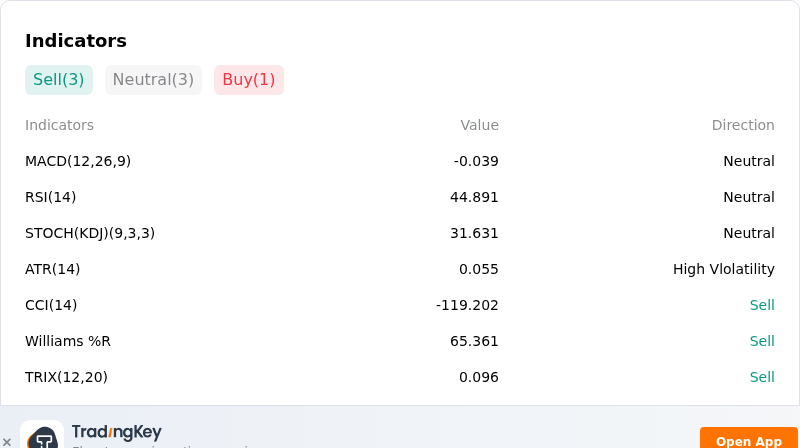
Technically, XRP (XRPUSD) shows a MACD (12,26,9) value of -0.039, indicating a neutral signal. The RSI at 44.891 suggests neutral condition and the Williams %R at 65.361 suggests sell condition. Please monitor closely.
More details about XRP (XRPUSD)
Recent Events and Risks:
- Leveraged Long Liquidations and Support Breakdown: A sharp market-wide de-risking flush triggered nearly $30 million in XRP long position liquidations, breaching key technical support around $1.40 and driving intraday spot prices down to multi-week lows near $1.32. Further breakdown beneath the cluster of daily exponential moving averages risks triggering secondary forced-selling cascades.
- Negative Perpetual Funding Rates and Bearish Derivatives Bias: Derivatives data across major exchanges highlights perpetual funding rates flipping negative alongside long-to-short ratios dropping below 0.90. This shift reflects a dominant short bias among leveraged market participants, leaving price action vulnerable to continued downside pressure as aggressive shorts press into support levels.
- Catalyst Delay and Decelerating Institutional ETF Flows: Anticipated corporate catalysts have encountered operational setbacks, such as the administrative delay of Evernorth's Nasdaq debut for its 473-million XRP treasury company. Simultaneously, weekly spot XRP ETF net inflows have decelerated sharply from previous multi-million-dollar peaks down to low single-digit millions, reducing the immediate institutional spot demand needed to absorb market selling.
- Macro Liquidity Shocks and Potential CEX Supply Overhang: Sovereign bond yields approaching multi-decade highs alongside surging geopolitical energy costs have created a broader risk-off backdrop for digital assets. Additionally, on-chain metrics show substantial token inflows into centralized exchanges—including roughly 1.6 billion XRP deposited into Binance over 30 days—maintaining significant potential sell-side liquidity overhang during risk-off sessions.
Recommended Articles


