


Crude Oil Price Forecast: WTI Nears $92 as Strait of Hormuz Crisis Offsets Russian Diesel Supply
TradingKey - As Middle East tensions remain high, global energy supplies face another test. On October 9 local time, Iran's Islamic Revolutionary Guard Corps claimed it attacked an LPG tanker in the Strait of Hormuz, sparking a fire, while separate reports indicated Yemen's Houthi militants may have laid sea mines in the Bab-el-Mandeb Strait. The news heightened market concerns over the security of key shipping routes, sending WTI crude oil futures (USOIL-F) to an intraday high of $92.17.
However, Trump later announced positive progress in a phone call with Russian President Putin, stating that Russia would supply additional diesel to the U.S. and global markets, which narrowed gains in the energy market. Nonetheless, oil prices ultimately settled higher, with WTI crude futures settling at $91.67 a barrel, up 0.55%, and Brent crude futures (UKOIL-F) settling at $104.53 a barrel, up 0.39%.
Strait of Hormuz Risks Heighten
Recent attacks on commercial vessels are adding new risks to Middle East energy shipments. The Strait of Hormuz connects the Persian Gulf to the Gulf of Oman and serves as a vital shipping lane for global energy transport. If passage through this waterway is restricted, oil-producing nations could struggle to deliver supplies to international markets due to transport disruptions, even if crude output remains ample.
Shipping data already reflects this pressure. According to Kpler data cited in the materials, crude oil exports via the Strait of Hormuz fell to around 8.5 million barrels per day in the week ended October 7, roughly 40% below normal pre-war levels. Crude exports from the entire Middle East region stood at about 15.3 million barrels per day, still around 10% below pre-war levels. This indicates that while some crude exports have recovered, the overall supply chain has not yet fully normalized.
Of greater concern, risks are spreading from the Strait of Hormuz into surrounding waters. Iranian-aligned military forces had previously expanded their targeting to other areas of the Persian Gulf, with recent reports of tankers being attacked near Qatar and along the UAE coast. If shipping security in the Bab-el-Mandeb Strait is also compromised, energy transport via the Red Sea could face heightened pressure. Reports also mentioned that Houthi forces might deploy naval mines, though this information should still be viewed with caution.
Trump and Putin Reach Diesel Supply Arrangement
On October 9 local time, Trump stated on social media that he held a positive phone call with Russian President Vladimir Putin, reaching an arrangement for Russia to increase diesel supplies to the U.S. and global markets. According to the plan released by Trump, Russia will immediately supply over 300,000 metric tons of diesel, another 500,000 metric tons in November, followed by an additional 1 million metric tons; if Russian refinery operations permit, a further 3 million metric tons will be supplied within a relatively short period.
Russia subsequently stated that it would lift diesel export restrictions ahead of schedule and plans to increase supplies in accordance with the arrangement. The move is expected to provide some relief to the tight diesel market, though the actual impact remains dependent on delivery timelines, refinery conditions, and shipping arrangements.
Since the outbreak of war involving the U.S., Israel, and Iran, U.S. diesel prices have surged by roughly 70%, with the national average rising to $6.28 per gallon on October 8. Rising diesel costs are squeezing profit margins in sectors such as trucking and agricultural production, while intensifying pressure on the U.S. government to curb the cost of living.
It should also be noted that an increase in diesel supply does not equate to a simultaneous increase in crude oil supply. While falling diesel prices may ease some pressure on refined product markets, they cannot directly eliminate the risk of shipping disruptions in the Strait of Hormuz.
Crude Oil Price Technical Analysis
Source: TradingView
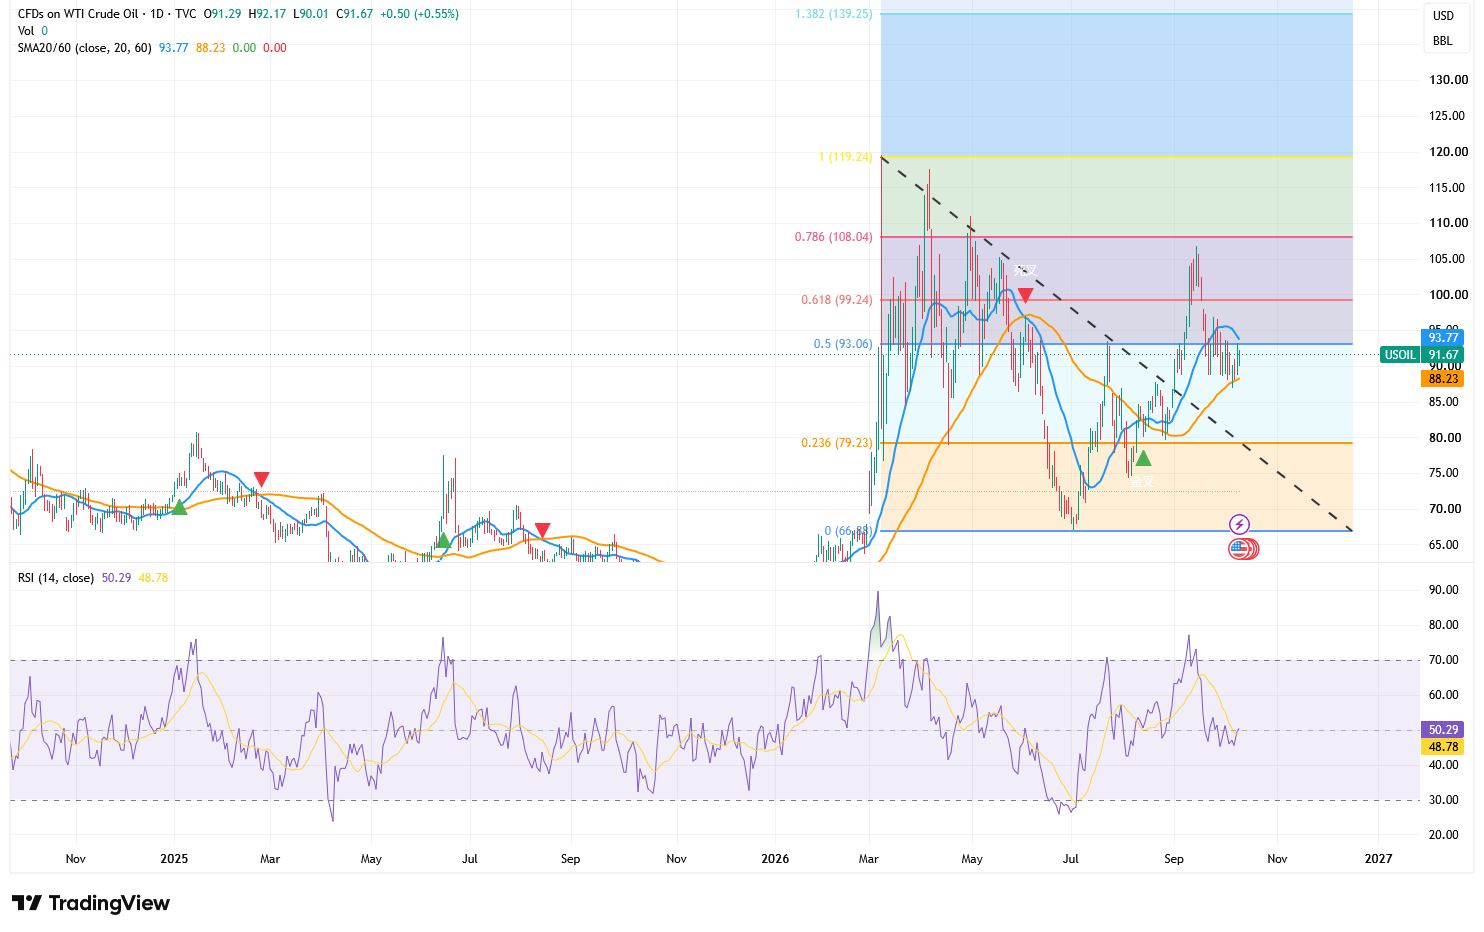
On the daily chart, WTI crude was last trading at $91.67, after touching an intraday high of $92.17. Oil prices have broken above the previous downtrend line and remained above the 60-day moving average of $88.23, indicating an improvement in the medium-term downward structure. However, prices remain below the 20-day moving average of $93.77, suggesting that short-term strength has not yet fully recovered.
The $92–$94 zone above is currently the most critical resistance area, where the 50% Fibonacci level sits at $93.06, forming technical confluence with the 20-day moving average. If WTI can achieve a daily close above $94, further upside space is expected to open up, with the next target at $99.24–$100; a further breakout could lead to a retest of $105 and $108.04. An intraday break above $92 alone is not enough to confirm that a new rally has begun.
The RSI currently stands at 50.29, slightly above its signal line of 48.78, indicating that bullish and bearish forces are roughly balanced and upward momentum is improving but remains modest. This also implies that oil prices may continue to fluctuate near key resistance in the short term.
To the downside, initial focus is on $90 and the 60-day moving average of $88.23. As long as oil prices hold $88, the medium-term rebound structure can be maintained; if prices close below $88 on a daily basis, a further pullback to $84–$85 could occur, or even a test of support at $79.23.
Recommended Articles


