


XRP (XRPUSD) Volatility Intensified on Oct 11: What You Should Know
XRP (XRPUSD) is up 1.35% at Oct 11 20:55(ET), now at $1.408, with a 7-day down of 6.48%.
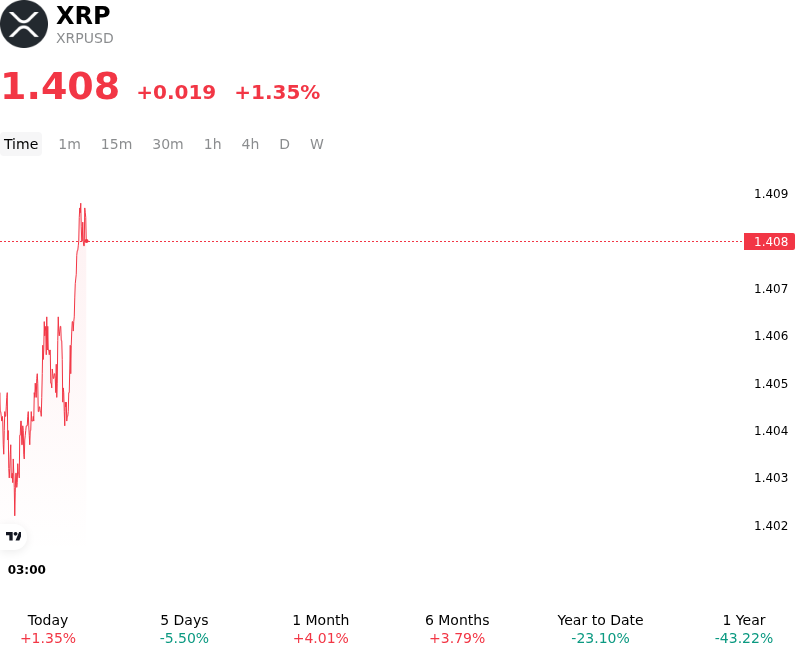
What is driving XRP (XRPUSD)’s stock price up today?
The upward movement in XRP reflects a combination of persistent spot ETF capital inflows, strategic corporate treasury accumulation, and resilient spot demand defending key structural technical support levels. Institutional participation through spot XRP exchange-traded products continues to provide a steady baseline of net buying pressure, progressively tightening available exchange float. Simultaneously, growing corporate treasury vehicles dedicated to holding XRP as a core asset have reinforced long-term adoption narratives, encouraging spot market accumulation among institutional market participants.
Ecosystem developments on the XRP Ledger have further supported investor sentiment. Recent mainnet protocol upgrades, including the activation of advanced batch transaction features, have enhanced network throughput and liquidity efficiency for institutional settlements and complex financial operations. These network improvements underscore expanding utility across cross-border payment rails and asset tokenization infrastructure, strengthening long-term fundamental valuation metrics and spurring buyer interest during local price consolidations.
From a market structure perspective, derivatives positioning across major exchanges remains healthy and moderately leveraged. Balanced funding rates and a measured rebuilding of open interest indicate that the price advance was primarily driven by spot liquidity rather than speculative leverage. As key technical support zones held firm, modest short covering combined with organic spot accumulation to push prices higher in an orderly trading environment.
Looking forward, XRP market dynamics remain tied to broader global macroeconomic liquidity, Federal Reserve monetary policy expectations, and cross-border regulatory developments. While sustained ETF net inflows and structural ledger upgrades offer ongoing fundamental support, institutional investors continue to monitor risks related to macroeconomic sentiment shifts, potential capital reallocation across top-tier digital assets, and broader market liquidity conditions. Overall, current price action demonstrates constructive institutional accumulation and stable market structure.
Technical Analysis of XRP (XRPUSD)
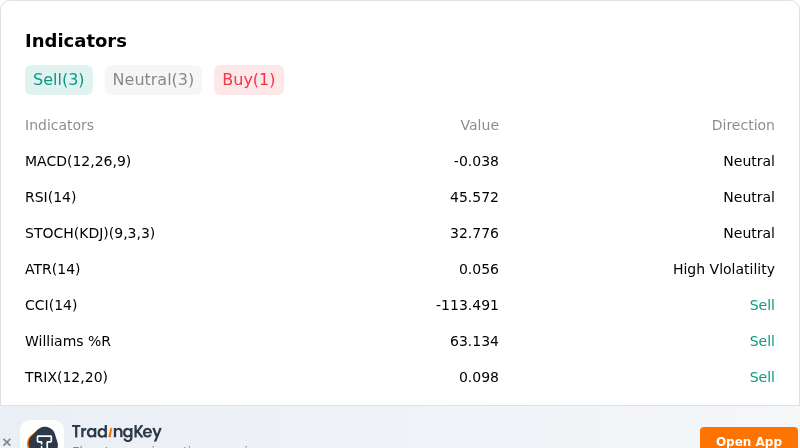
Technically, XRP (XRPUSD) shows a MACD (12,26,9) value of -0.038, indicating a neutral signal. The RSI at 45.572 suggests neutral condition and the Williams %R at 63.134 suggests sell condition. Please monitor closely.
More details about XRP (XRPUSD)
Recent Events and Risks:
- Macro Yield Spike and Cross-Asset Risk-Off Pressure: Escalating macro headwinds, driven by rising U.S. Treasury yields and a strengthening U.S. dollar, have triggered a broader digital asset sell-off, pushing XRP down past key technical levels from recent highs around $1.52 toward $1.39.
- Derivatives Liquidation Cascade: A sharp market-wide drop triggered over $400 million in long position liquidations across major exchanges in a single hour, unwinding leveraged positions and compounding intraday downside momentum for XRP.
- Technical Breakdown Below Key Support Levels: XRP's breach below its 200-day moving average and failure to hold short-term support in the $1.44–$1.46 range has flipped prior floors into resistance, elevating the risk of extended downside toward Fibonacci retracement support near $1.32.
- Deteriorating Order Book Depth and Retail Dominance: On-chain and exchange metrics reveal a steep drop in the exchange Whale vs. Retail Spread from 64% to 46.7%, reflecting reduced institutional liquidity provision and leaving market structure more vulnerable to retail-driven selling and volatility spikes.
Recommended Articles


