


APi Group Corp Stock (APG) Moved Down by 10.17% on Sep 9: Key Drivers Unveiled
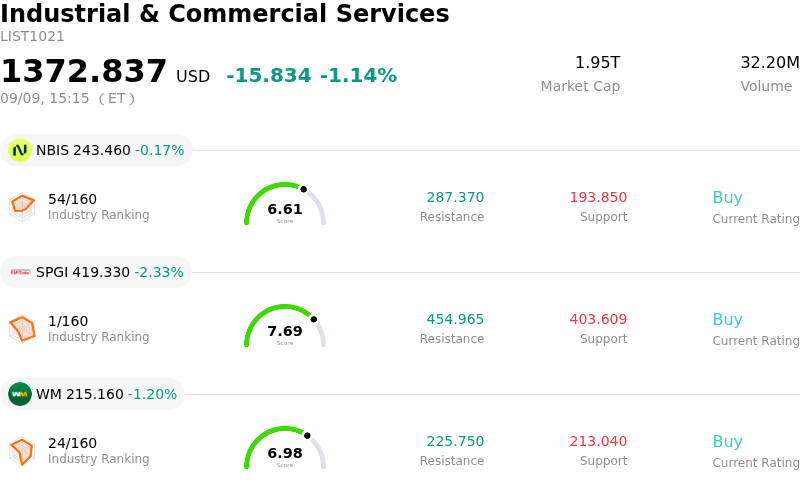
APi Group Corp (APG) moved down by 10.17%. The Industrial & Commercial Services sector is down by 1.14%. The company underperformed the industry. Top 3 stocks by turnover in the sector: Nebius Group NV (NBIS) down 0.17%; S&P Global Inc (SPGI) down 2.27%; Waste Management Inc (WM) down 1.20%.
What is driving APi Group Corp (APG)’s stock price down today?
Investor sentiment shifted downward during APi Group Corporation's presentation at the Jefferies Global Industrials Conference. Although executive management reiterated long-term operational targets and highlighted a record contract backlog, market participants reacted cautiously to discussions regarding project timing, labor availability, and margin discipline in non-core services. The conference dialogue prompted short-term profit-taking, as investors reassessed the pace of near-term organic growth against a backdrop of broader industrial sector headwinds.
Sentiment was further weighed down by persistent insider selling disclosures leading into the session. Filings indicating substantial share dispositions by corporate directors and key investment holdings under Rule 10b5-1 plans created overhead supply pressure. Institutional investors often digest concentrated insider liquidations with heightened caution, which compounded downside momentum as market participants adjusted risk exposure.
Operational execution and integration risks related to recent acquisitions also contributed to the pull-back. Although recent transactions like Onyx-Fire Protection Services and WTech Fire Group enhanced top-line guidance, the market remains focused on potential margin dilution, rising input costs, and integration overhead. Investors are increasingly demanding clear evidence that accretive M&A will translate into sustained expansion of profit margins without compromising cash flow generation.
Despite the sharp downward volatility, APi Group's core fundamental thesis continues to rely on statutorily mandated safety inspections, high recurring service revenues, and an expanding order book. Near-term share performance, however, is expected to stay sensitive to margin execution metrics, integration milestones, and technical positioning as the market absorbs current institutional and insider rebalancing.
Technical Analysis of APi Group Corp (APG)
Technically, APi Group Corp (APG) shows a MACD (12,26,9) value of -0.760, indicating a sell signal. The RSI at 28.027 suggests sell condition and the Williams %R at 91.661 suggests oversold condition. Please monitor closely.
Fundamental Analysis of APi Group Corp (APG)
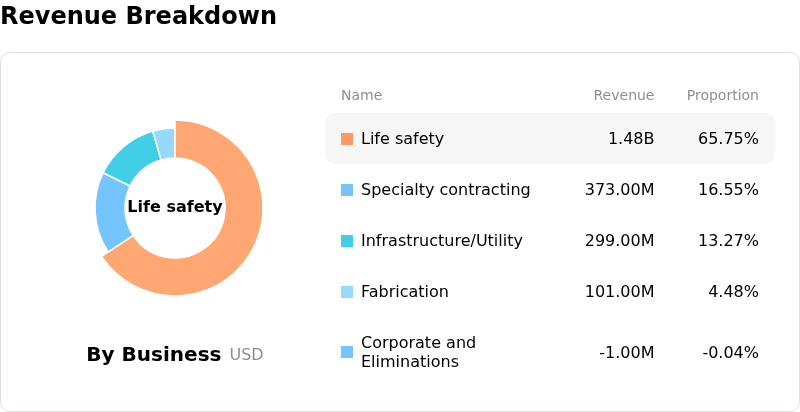
APi Group Corp (APG) is in the Industrial & Commercial Services industry. Its latest annual revenue is $7.91B, ranking 8 in the industry. The net profit is $-288.00M, ranking 63 in the industry. Company Profile
Over the past month, multiple analysts have rated the company as Buy, with an average price target of $52.60, a high of $55.00, and a low of $47.00.
More details about APi Group Corp (APG)
Company Specific Risks:
- Acquisition Integration and Margin Pressures: Rapid capital deployment into recent bolt-on acquisitions—including WTech Fire Group and Onyx-Fire Protection Services—heightens execution risks, as any operational disruptions or delays in realizing cost synergies could pressure gross margins and cash flow.
- Substantial Insider Share Offloading: SEC Form 4 and Form 144 disclosures reveal over $110 million in insider share sales over the past quarter, including multi-million-dollar sales by directors, creating equity overhang and signaling cautious sentiment from key leadership.
- Debt-Financed Balance Sheet Expansion: Recent aggressive M&A activity has required additional leverage, raising debt service requirements and leaving profitability vulnerable if high interest rates persist or debt-funded assets generate lower-than-expected returns.
- Input Cost Inflation and Supply Chain Risk: Ongoing cost inflation for specialized labor and materials, along with potential tariff pressures, threatens contract profitability across Safety and Specialty Services segments if cost increases cannot be passed onto clients.
Recommended Articles


