


Dollar Index loses its CPI gain as AI stocks slide
- DXY round-trips Wednesday's CPI spike and drops to a six-session low.
- Money leaves AI stocks for Treasuries, and the 10-year hits a three-week low.
- Fed Chair Warsh speaks in Bangkok Friday, a day before Fed officials go quiet.
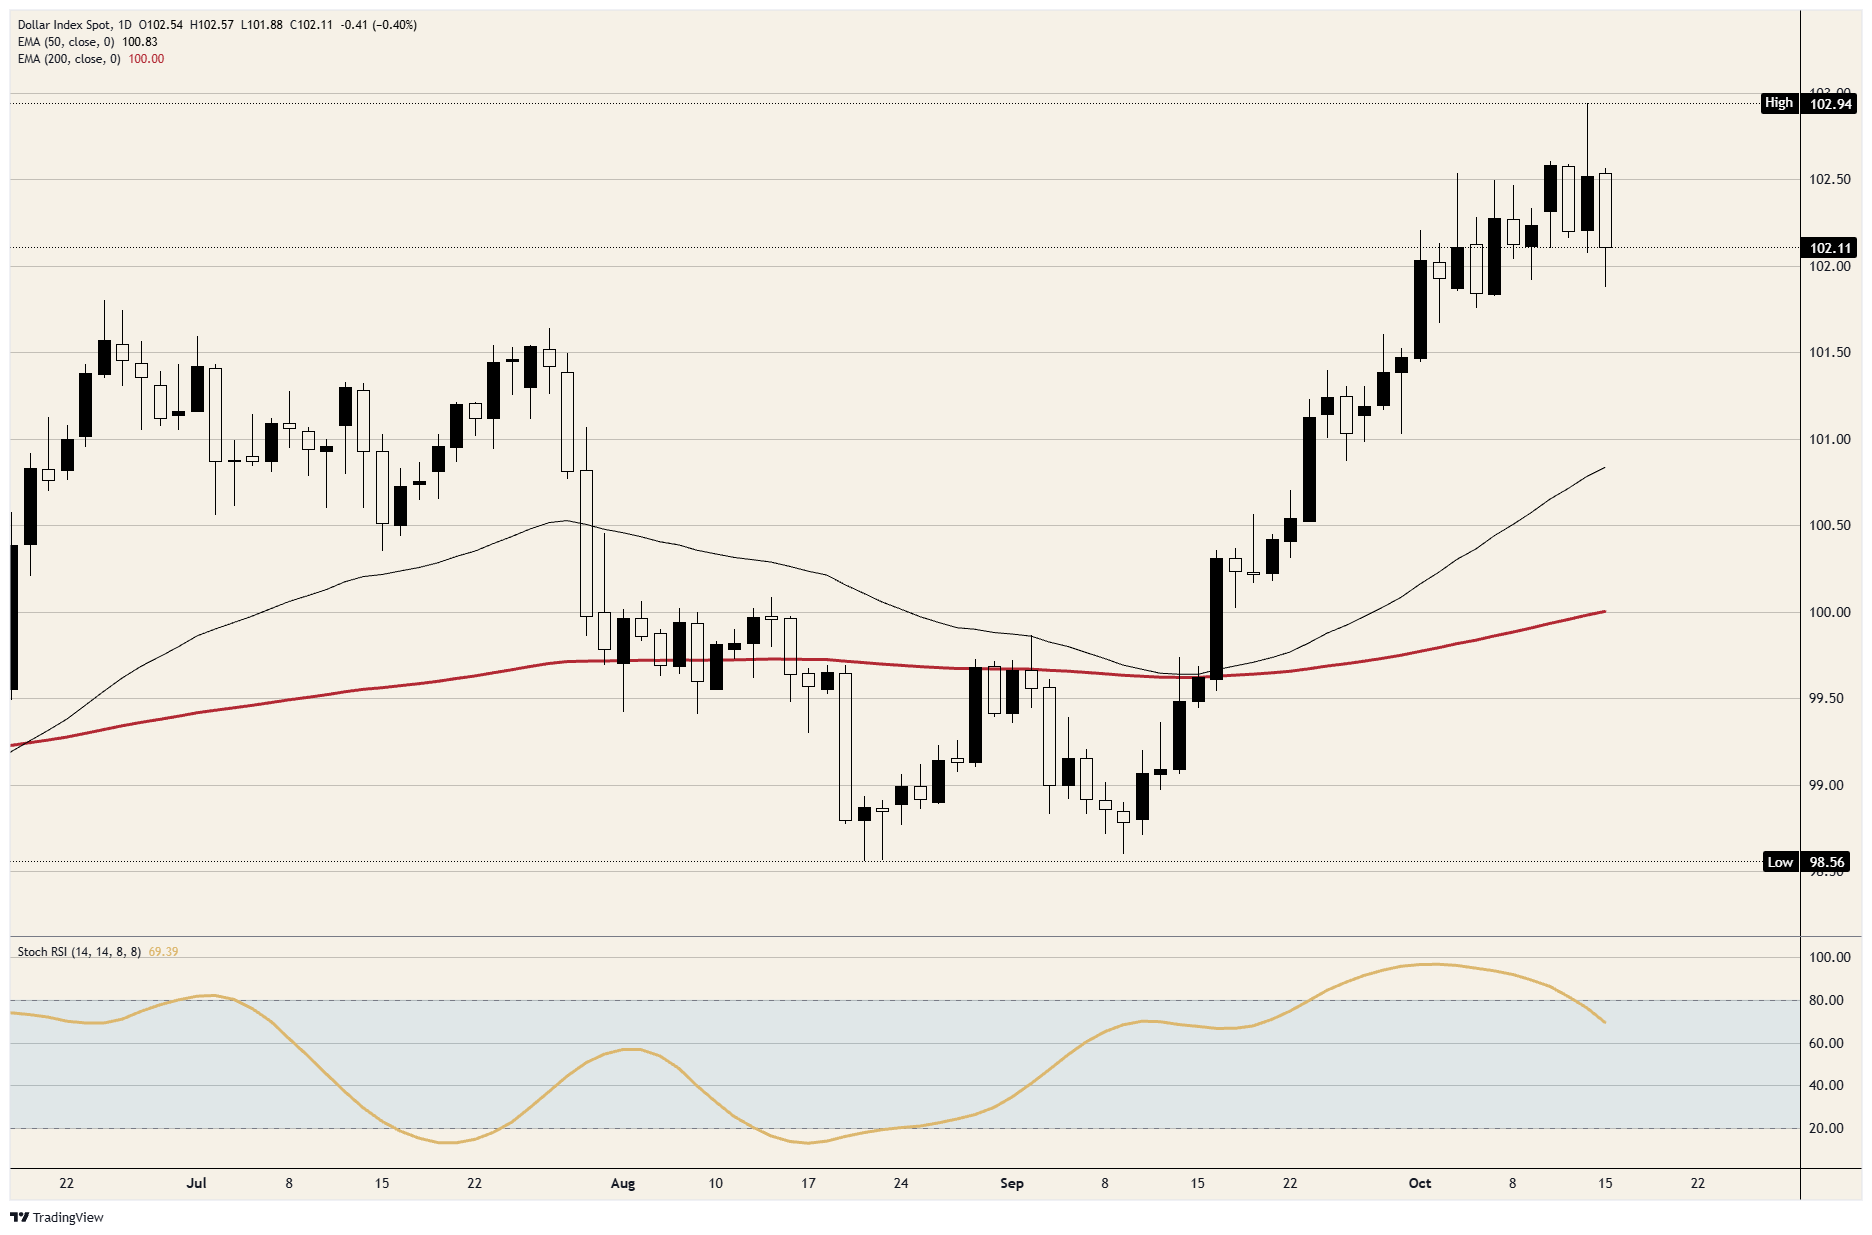
An artificial intelligence (AI) stock rout has pushed money into Treasuries, and the Dollar Index gave back its gain on Wednesday's Consumer Price Index (CPI) print. It dropped from Wednesday's high just under 103.00, its highest in 18 months, to just under 101.90, its lowest since October 7. A spike to about 102.25 on the producer price release was gone by the next five-minute bar.
Higher US rates raised the cost of the debt behind the AI data centre build, and bond yields for the most indebted builders hit records as their shares fell. State Street puts the hedged share of foreign-owned US stocks below 15%, against about 25% in April, so foreigners who sell US tech and take the money home sell Dollars. The rout reaches the Dollar twice, through the 10-year yield's fall to a three-week low and through that selling.
US producer prices rose 1.3% in September, above the 0.5% forecast, with energy accounting for about half. Retail sales rose 0.8%, but the control group rose 0.1% and gas stations took $4.1 billion of the $5.7 billion gain, on the same gasoline that lifted producer prices. The 10-year yield fell after the biggest jump in producer prices since March 2022.
On the calendar
Cleveland Fed President Hammack, who said on October 12 she'd rather hike in small steps quickly than wait, speaks at 20:30 GMT on Thursday. She didn't back a move at the October 27-28 meeting, and bets on a hike there are back near one in four, where they began the week. A December hike is priced near 90%.
Fed Chair Warsh speaks at the International Monetary Fund (IMF) meetings in Bangkok at 03:30 GMT on Friday, and Fed officials stop commenting publicly from October 17. September industrial production follows at 13:15 GMT, forecast up 0.4% after a flat August.
On the charts
The index broke above the 101.75-102.60 range it had held since October 5 on Wednesday's spike, and it's back in the middle of it near 102.10. The drop from that high to Thursday's low is about a quarter of the climb that started near 98.60 on September 9. Daily momentum has dropped out of overbought for the first time since late September.
DXY daily chart
US Dollar FAQs
The US Dollar (USD) is the official currency of the United States of America, and the ‘de facto’ currency of a significant number of other countries where it is found in circulation alongside local notes. It is the most heavily traded currency in the world, accounting for over 88% of all global foreign exchange turnover, or an average of $6.6 trillion in transactions per day, according to data from 2022. Following the second world war, the USD took over from the British Pound as the world’s reserve currency. For most of its history, the US Dollar was backed by Gold, until the Bretton Woods Agreement in 1971 when the Gold Standard went away.
The most important single factor impacting on the value of the US Dollar is monetary policy, which is shaped by the Federal Reserve (Fed). The Fed has two mandates: to achieve price stability (control inflation) and foster full employment. Its primary tool to achieve these two goals is by adjusting interest rates. When prices are rising too quickly and inflation is above the Fed’s 2% target, the Fed will raise rates, which helps the USD value. When inflation falls below 2% or the Unemployment Rate is too high, the Fed may lower interest rates, which weighs on the Greenback.
In extreme situations, the Federal Reserve can also print more Dollars and enact quantitative easing (QE). QE is the process by which the Fed substantially increases the flow of credit in a stuck financial system. It is a non-standard policy measure used when credit has dried up because banks will not lend to each other (out of the fear of counterparty default). It is a last resort when simply lowering interest rates is unlikely to achieve the necessary result. It was the Fed’s weapon of choice to combat the credit crunch that occurred during the Great Financial Crisis in 2008. It involves the Fed printing more Dollars and using them to buy US government bonds predominantly from financial institutions. QE usually leads to a weaker US Dollar.
Quantitative tightening (QT) is the reverse process whereby the Federal Reserve stops buying bonds from financial institutions and does not reinvest the principal from the bonds it holds maturing in new purchases. It is usually positive for the US Dollar.
Recommended Articles


