


The Federal Reserve Is Raising Interest Rates. Here's What History Says That Means for Investors.
Key Points
Interest rates have inched higher from nearly nothing in 2022 to multi-year highs now.
Although it's not yet slowed the stock market's advance, there's reason for investors to be concerned.
Investors would be best served by driving straight into this headwind, knowing it will eventually reverse course.
- 10 stocks we like better than S&P 500 Index ›
Interest rates are on the rise. Just last month, the Federal Reserve raised the federal funds rate by another quarter of a percentage point, pushing it to a target range of between 3.75% and 4%. Traders are betting on at least one more quarter-point hike before year-end, too. It's a far cry from the early 2022 fed funds rate of less than 0.25%, when lingering inflation forced the Federal Open Market Committee (FOMC) to act.
These rising interest rates are impacting investors as well. Higher rates are meant to slow the economic growth that's fostering inflation, but slower economic growth also works against for-profit companies. Plenty of people are understandably uncertain as to what the future holds, and they're staying on the sidelines. They're right to be concerned, too, if history is any indication.
Missed Nvidia in 2009? This Rare Signal Is Flashing Again. In 2009, a "Double Down" signal flashed for a little-known chipmaker called Nvidia. For the first time in years, that same "Total Conviction" signal is flashing for a company 1/100th the size of Nvidia. Continue »
Still, attempting to sidestep this impact may pose more net risk than net reward. See, while we generally know what's likely to happen from here, we're also missing some key details about what awaits.
There's something to it
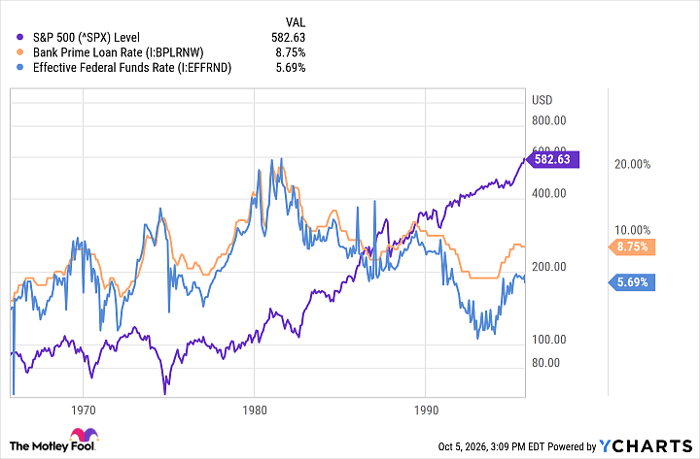
Yes, generally speaking, higher (or at least rising) interest rates coincide with market weakness. As the graphic below illustrates, between 1965 and 1995, most -- although not all -- of the S&P 500's (SNPINDEX: ^GSPC) periods of pronounced weakness coincided with an increase in interest rates, like the late 1960s and then again in the mid-1970s. Conversely, the index performed pretty bullishly when interest rates were low and/or falling.
^SPX data by YCharts
The one obvious exception to this correlation is the late 1970s into the early 1980s, when neither soaring inflation nor sky-high interest rates could slow the stock market. This was a secular bull market, though, rooted in factors beyond the economic backdrop.
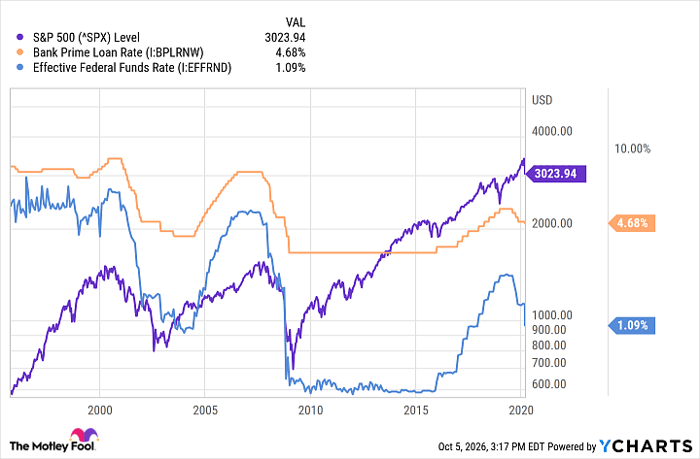
The 25 years between 1995 and when the COVID-19 pandemic first rattled the entire global economy say the same. Even excluding the dot-com craze of the late 1990s and its implosion in the early 2000s, we can see that the unusually high interest rates meant to curb the overheating housing market in 2007 eventually did so, but those same high interest rates then took an exaggerated toll on the S&P 500 in 2008.
^SPX data by YCharts
It remains to be seen how, when, or if the recent increase in interest will impact the stock market. But it would be naïve to pretend it's not crimping the economy. Many would-be homebuyers are sidelined, and loan delinquencies are up. It's surprising that the S&P 500 is still inching higher, unless the crowd is betting on something bullish just beyond the horizon.
Not predictable enough
Although rising interest rates present a potential problem for stock prices, what neither of the images above tells us is when any selling might take hold, or how long it might last. They also don't tell you how much of a pullback the S&P 500 might suffer. They can't even truly confirm a sell-off is inevitable.
That's why you might not want to worry too much about the current backdrop, even knowing the risks -- the bigger risk remains not being fully invested in the stock market when you should be.
To this end, as compelled as you may be to preemptively respond, the smart-money move here remains just holding a portfolio of quality stocks and taking your lumps, knowing they'll bounce back once the backdrop turns bullish again.
Should you buy stock in S&P 500 Index right now?
Before you buy stock in S&P 500 Index, consider this:
The Motley Fool Stock Advisor analyst team just identified what they believe are the 10 best stocks for investors to buy now… and S&P 500 Index wasn’t one of them. The 10 stocks that made the cut could produce monster returns in the coming years.
Consider when Netflix made this list on December 17, 2004... if you invested $1,000 at the time of our recommendation, you’d have $370,440!* Or when Nvidia made this list on April 15, 2005... if you invested $1,000 at the time of our recommendation, you’d have $1,470,022!*
Now, it’s worth noting Stock Advisor’s total average return is 955% — a market-crushing outperformance compared to 215% for the S&P 500. Don't miss the latest top 10 list, available with Stock Advisor, and join an investing community built by individual investors for individual investors.
See the 10 stocks »
*Stock Advisor returns as of October 7, 2026.
James Brumley has no position in any of the stocks mentioned. The Motley Fool has no position in any of the stocks mentioned. The Motley Fool has a disclosure policy.
Recommended Articles


