


Ripple Forecast: XRP tumbles as sell-side pressure intensifies
- XRP sellers tighten their grip as headwinds weigh on price action near $1.45.
- XRP derivatives see a sharp decline to 3.4 billion XRP in perpetual futures Open Interest as retail demand wanes.
- Momentum indicators remain bearish, reducing the odds of an immediate recovery despite mild ETF inflows.
Ripple (XRP) edges lower and trades at $1.45 on Wednesday, as headwinds intensify across the crypto market. Major crypto assets remain in bearish hands, with Bitcoin (BTC) falling below $84,000 and Ethereum (ETH) below $2,800. The remittance token has seen three straight days of declines, weighed down by a deteriorating technical structure.
XRP faces fading retail demand and mild ETF inflows
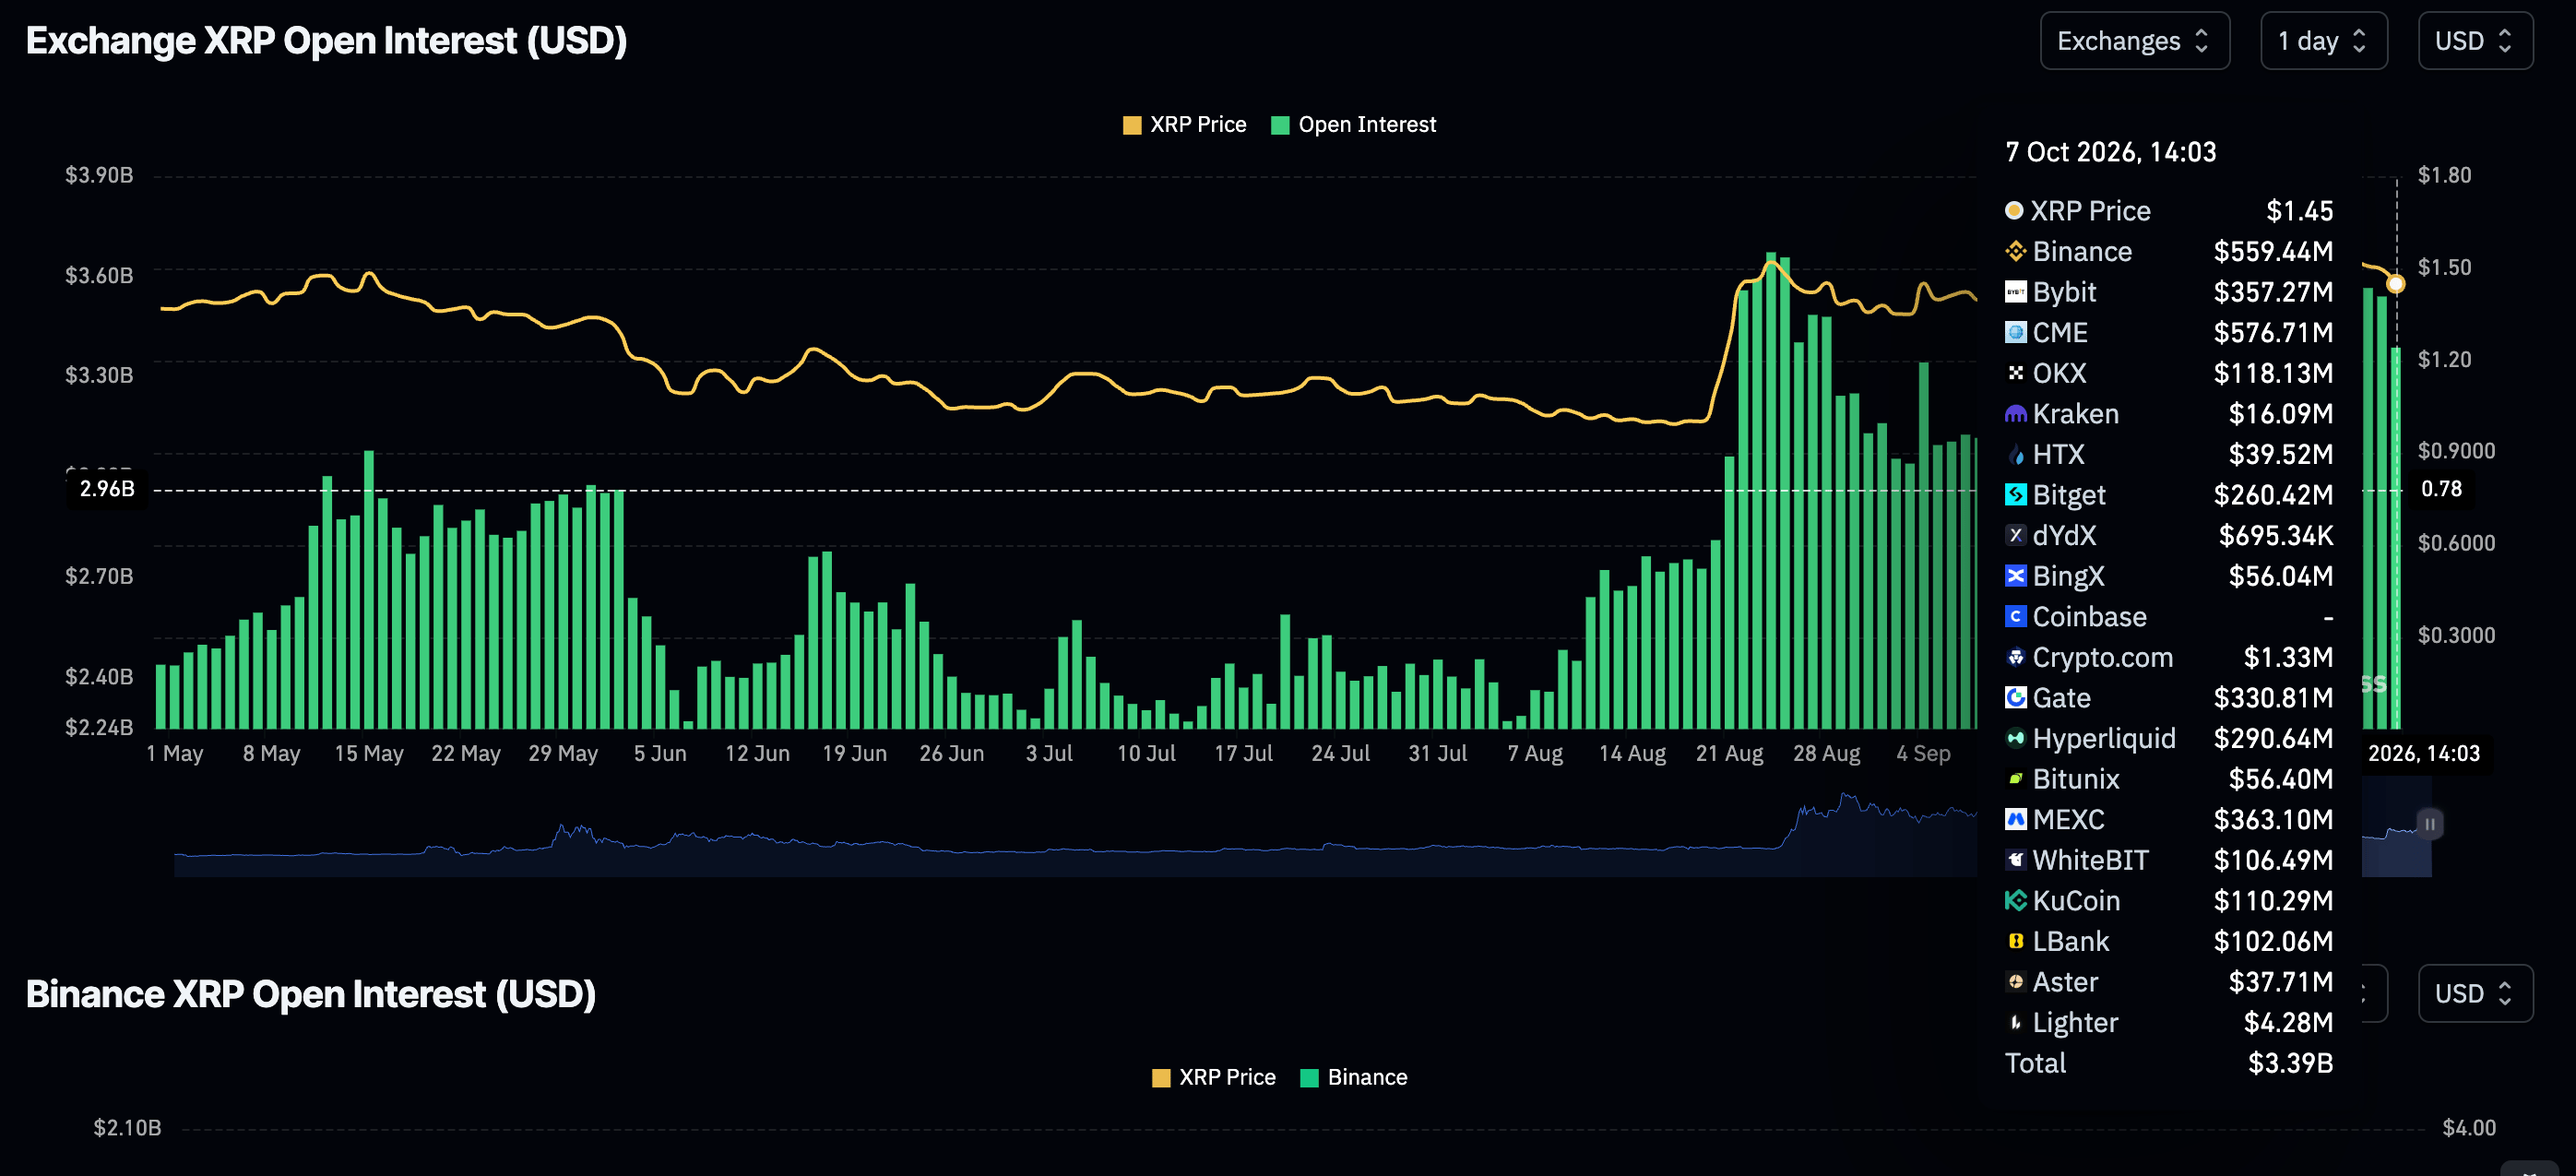
Appetite for XRP derivatives has taken a back seat, with futures Open Interest (OI) falling to 3.4 billion XRP on Wednesday, from 3.6 billion XRP the day before. Broadly, OI has fallen from the September peak of 3.8 billion, suggesting that sentiment has shifted from bullish toward bearish. If sustained, the decline will weigh on price action and lead to an extended sell-off.
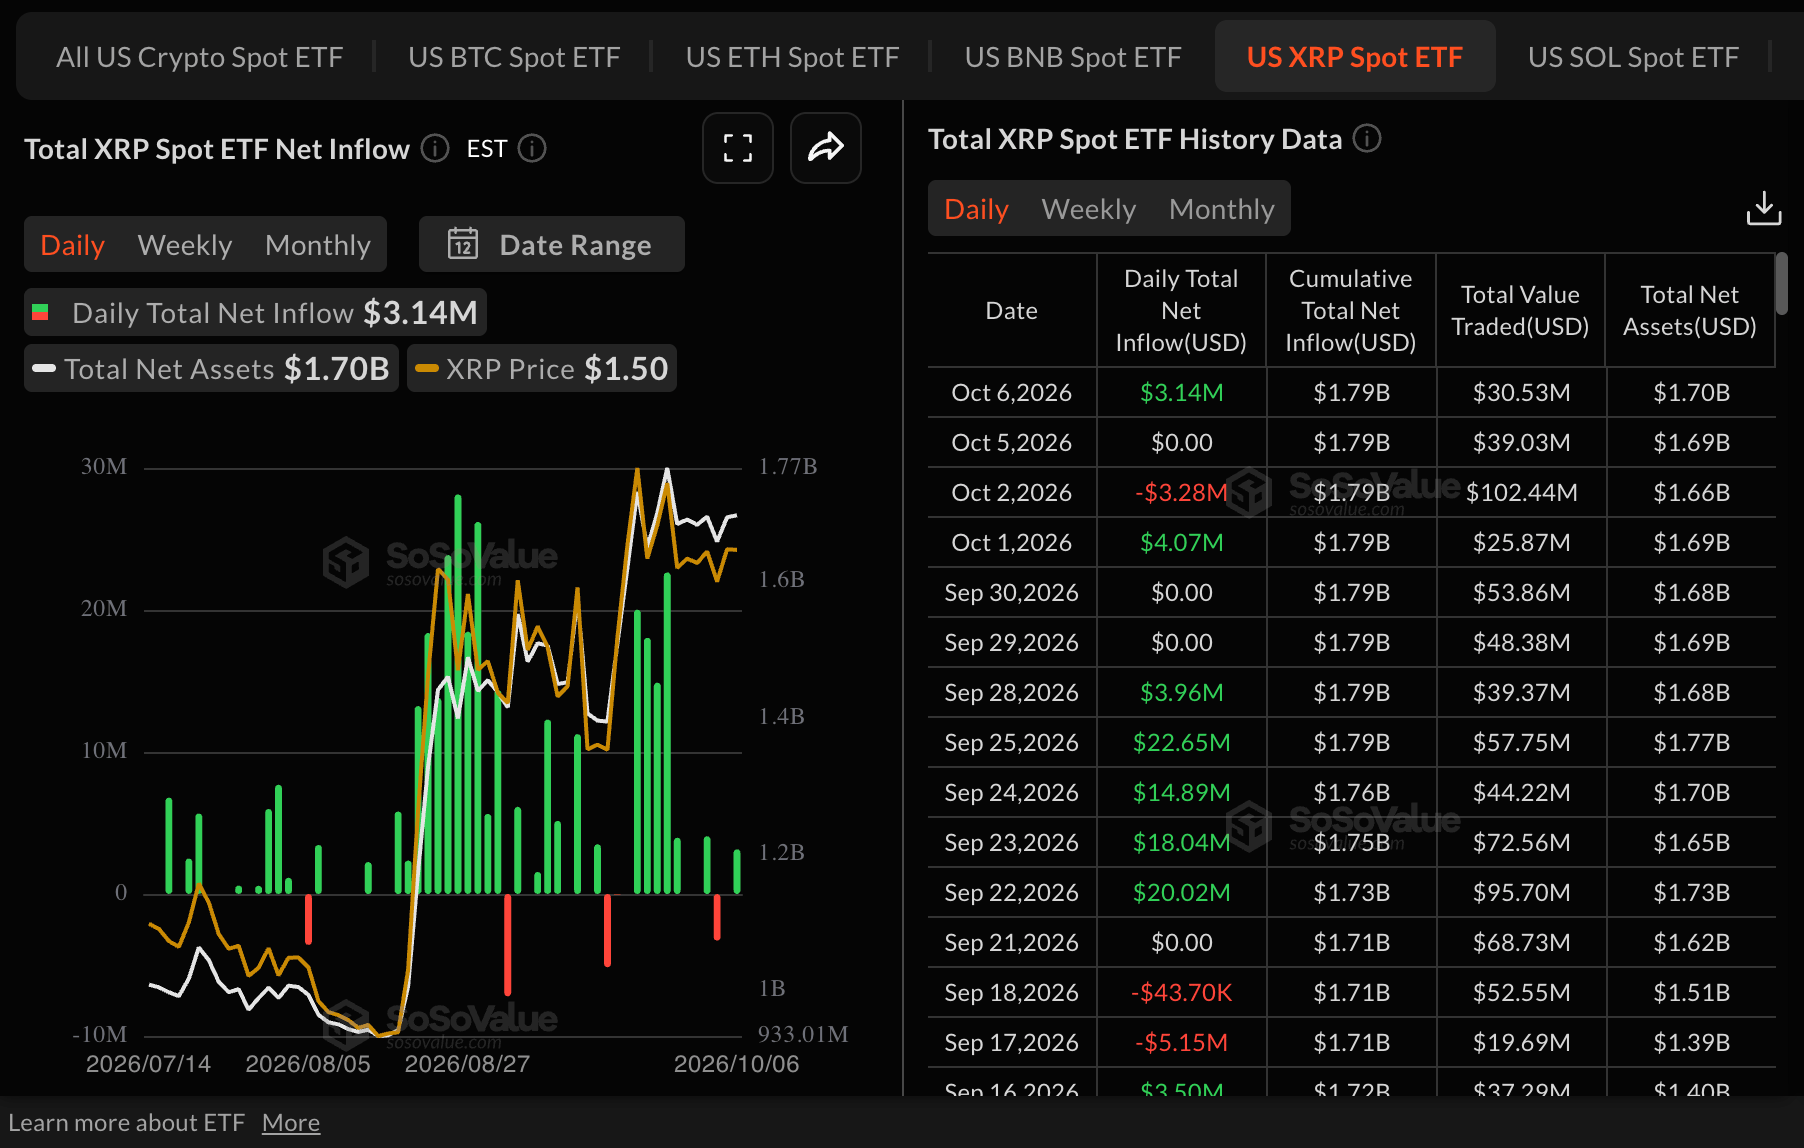
Demand for XRP spot Exchange-Traded Funds (ETFs) made a mild comeback, with inflows totaling $3 million on Tuesday. These inflows followed muted activity on Monday and $3 million in outflows last Friday, signaling growing risk-off sentiment.
Technical analysis: XRP tests key support
XRP trades at $1.45 on the third day of consecutive declines. Despite the correction, the remittance token maintains a bullish near-term bias as price holds above a dense floor of Exponential Moving Averages (EMAs). The 50-day EMA at $1.40, together with the 200-day EMA at $1.38 and the 100-day EMA at $1.33, reinforces an underlying demand zone beneath spot, while the SuperTrend indicator at $1.30 underpins the broader constructive structure.
Momentum has softened, with the Relative Strength Index (RSI) slipping toward a neutral 48 and the Moving Average Convergence Divergence (MACD) turning negative again, hinting at waning upside pressure but not yet negating the supportive trend backdrop.
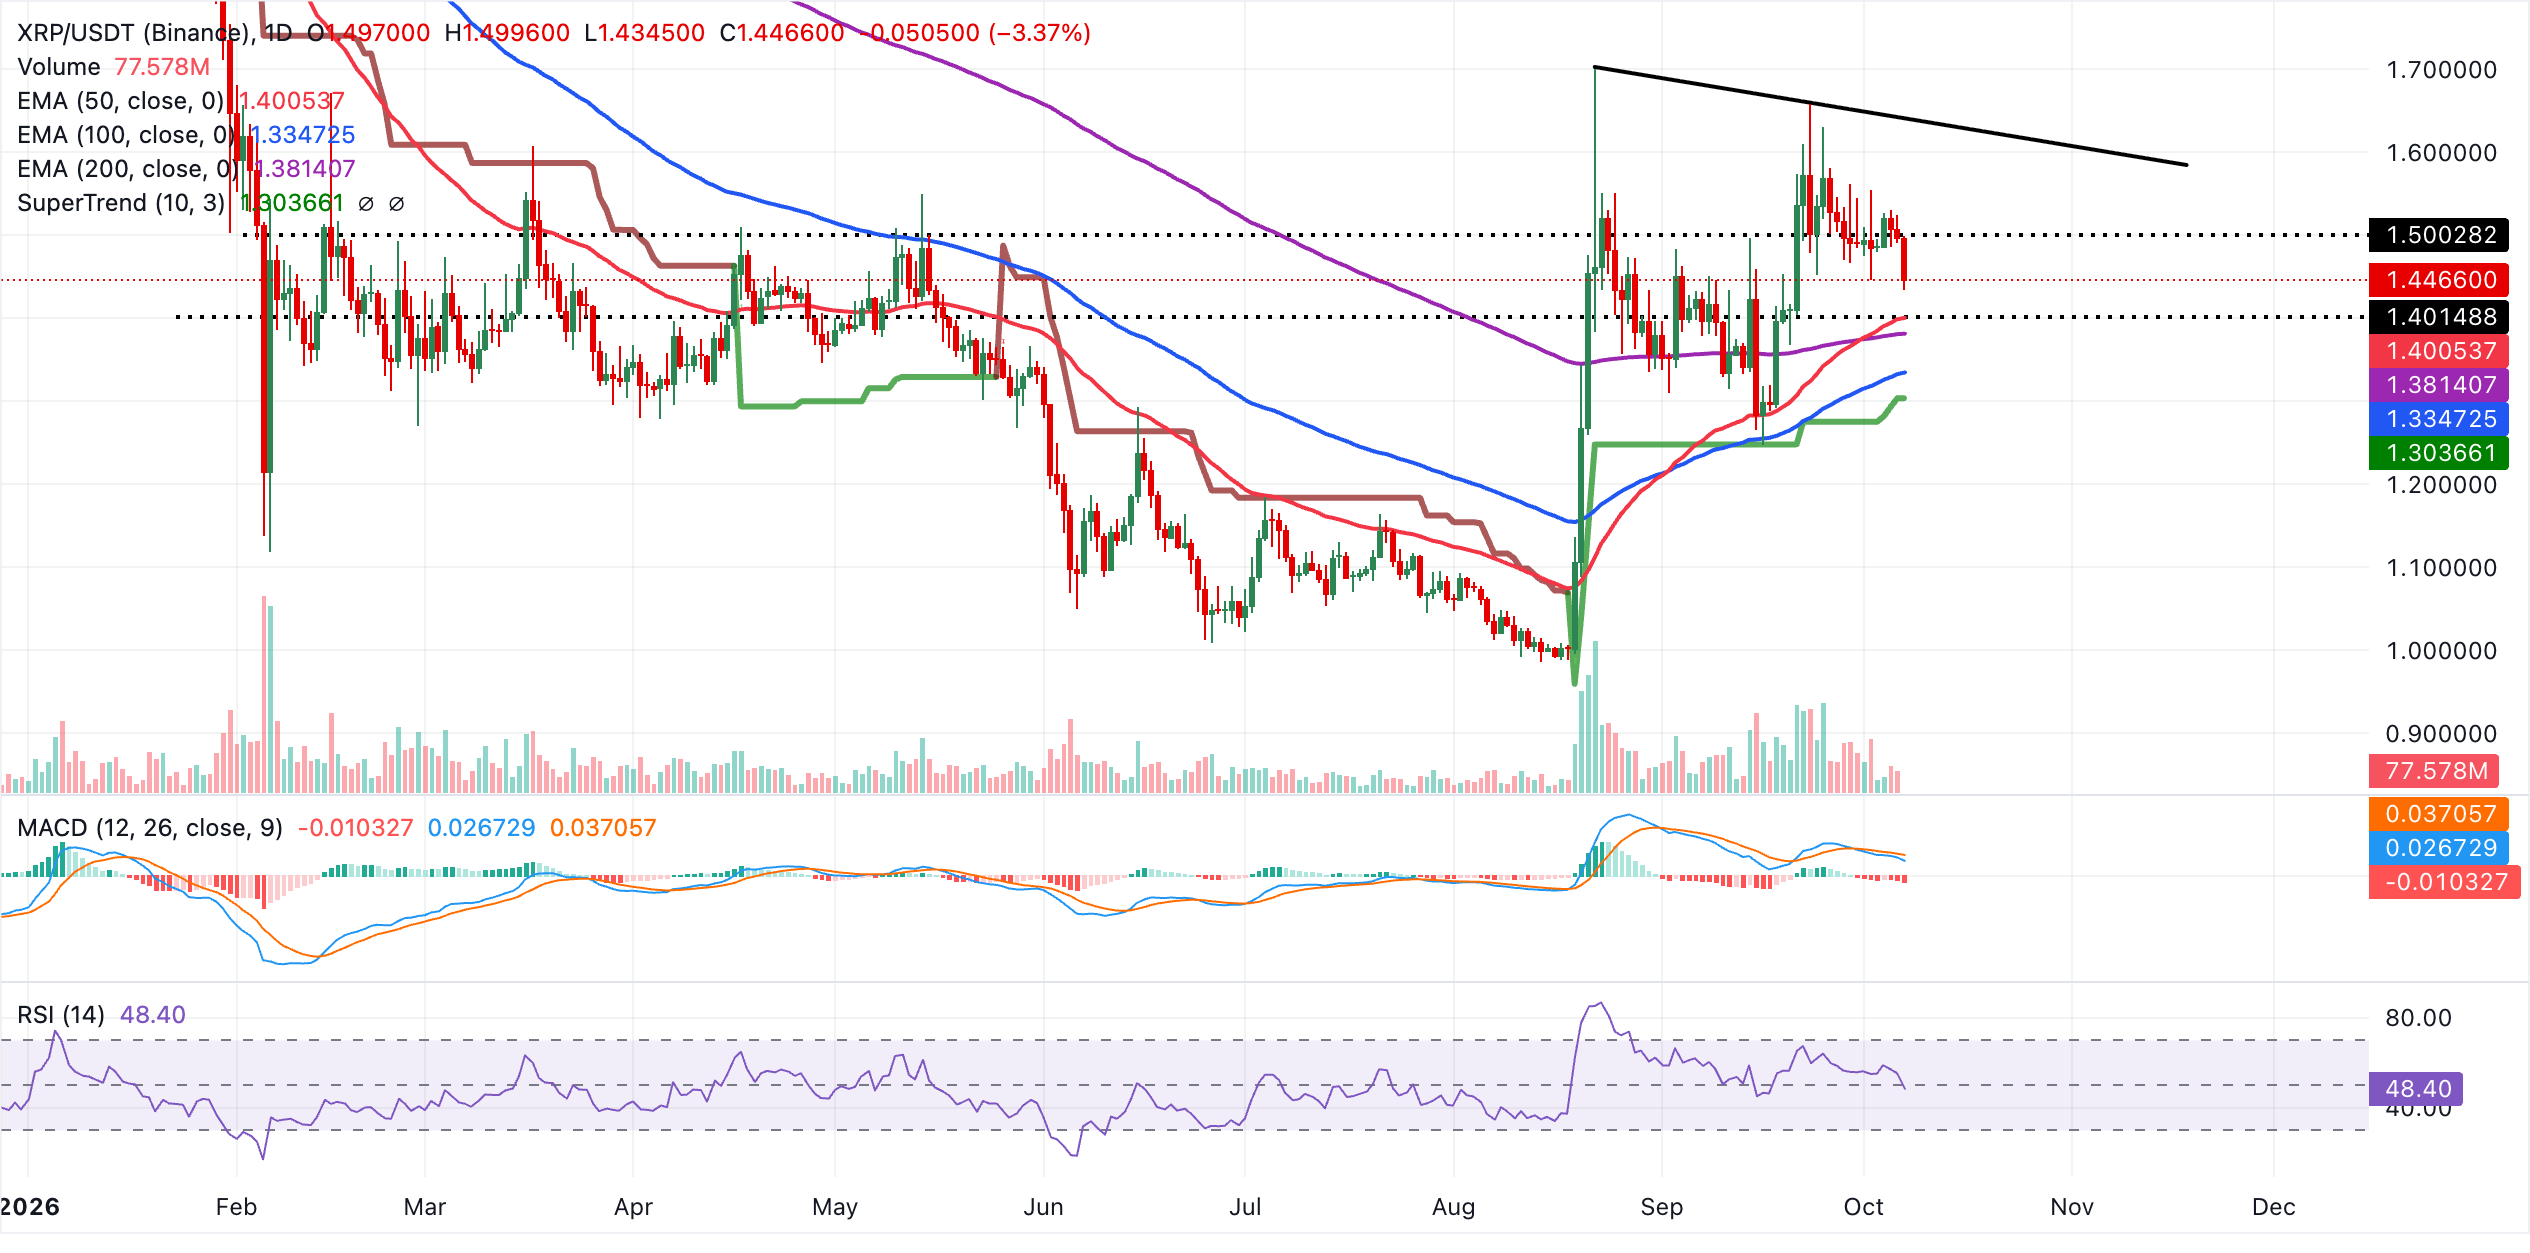
Immediate support lies at the 50-day EMA at $1.40, followed by the 200-day EMA at $1.38 and the 100-day EMA at $1.33, with the SuperTrend line at $1.30 marking a more strategic bullish line in the sand. On the topside, XRP faces key resistance at the prior downward trend-line break price near $1.64, with the trend-line start level at $1.70 as the next barrier.
A sustained push through this band would open the way for a renewed advance, while failure to hold above the clustered EMAs below could shift the bias toward consolidation.
(The technical analysis of this story was written with the help of an AI tool. Know more.)
Bitcoin, altcoins, stablecoins FAQs
Bitcoin is the largest cryptocurrency by market capitalization, a virtual currency designed to serve as money. This form of payment cannot be controlled by any one person, group, or entity, which eliminates the need for third-party participation during financial transactions.
Altcoins are any cryptocurrency apart from Bitcoin, but some also regard Ethereum as a non-altcoin because it is from these two cryptocurrencies that forking happens. If this is true, then Litecoin is the first altcoin, forked from the Bitcoin protocol and, therefore, an “improved” version of it.
Stablecoins are cryptocurrencies designed to have a stable price, with their value backed by a reserve of the asset it represents. To achieve this, the value of any one stablecoin is pegged to a commodity or financial instrument, such as the US Dollar (USD), with its supply regulated by an algorithm or demand. The main goal of stablecoins is to provide an on/off-ramp for investors willing to trade and invest in cryptocurrencies. Stablecoins also allow investors to store value since cryptocurrencies, in general, are subject to volatility.
Bitcoin dominance is the ratio of Bitcoin's market capitalization to the total market capitalization of all cryptocurrencies combined. It provides a clear picture of Bitcoin’s interest among investors. A high BTC dominance typically happens before and during a bull run, in which investors resort to investing in relatively stable and high market capitalization cryptocurrency like Bitcoin. A drop in BTC dominance usually means that investors are moving their capital and/or profits to altcoins in a quest for higher returns, which usually triggers an explosion of altcoin rallies.
Recommended Articles


