


UPS Stock Forecast: Nearly 7% Dividend Yield Meets a Holiday Recovery Test
TradingKey - United Parcel Service (UPS) ended the previous trading day at $93.74, losing 0.55%. UPS currently trades below the major moving averages. Also, management increased its long-term growth outlook and UPS recently finalized its agreement with Amazon.com. UPS completed the planned Amazon volume glide-down and related network reconfiguration in June 2026 rather than finalizing a new agreement. Investors are now waiting for more information regarding UPS’s new network. UPS must prove that the new network improves its cash flow and profitability during the peak season while supporting an approximately 7% dividend yield.
Holiday Surcharges Put Pricing Power to the Test
UPS is currently testing its pricing power with a series of new surcharges. UPS recently notified its customers of a series of new demand surcharges that took effect on September 27 on U.S. domestic package deliveries. Residential surcharges will go into effect later in October. Other new surcharges recently implemented by UPS will be effective on packages that are larger and/or exceed the maximum weight limit. UPS also updated surge emergency fees for certain U.S. imports and exports effective September 18. UPS will hopefully realize an improvement in its peak season revenue per package with the recently implemented surcharges and demand rates. Pricing power is an improvement in operating profit and cash flow for the company.
Q2 Adjusted Earnings Improved, but Reported Results Carried Heavy Charges
Revenue for the quarter was $22.8 billion. Operating profit was $930 million. Adjusted operating profit was $2.1 billion. Operating margin was 4.1% and adjusted operating margin was 9.2%. Earnings per share were $0.71 and $1.76, respectively. The negative difference was primarily due to a $891 million after tax charge related to workforce reduction, of which $1.05 per share was charged to transform the business. UPS said those transformation charges consisted primarily of employee separation costs tied to workforce-reduction initiatives under its recently completed Driver Choice Program. There are costs associated with restructuring and business changes. However, in our view, the stronger turnaround would show improved earnings with a better operating margin and would not require significant adjustments.
The Amazon Volume Reset Is Complete
As of the June quarter, UPS indicated the volume transition and related adjustments to the service network for Amazon were completed. This was designed to improve the average profitability and the return on investment for the business. The profitability and return improvements for the revenue mix will require positive changes to the average volume. Aligning capacity, resources, and demand can help improve profitability and returns. However, if the average demand for the transported packages remains low, there could be a risk of greater-than-expected duration for achieving the target profitability and returns.
The New Global Operating Model Raises the Execution Bar
UPS launched a new global operating model on September 1. As part of the new model, Nando Cesarone was appointed the chief of global operations, and Matt Guffey was appointed to head U.S. domestic operations. More precisely, Cesarone became Executive Vice President and Chief Global Operations Officer, while Guffey became Executive Vice President and Chief U.S. Domestic Officer. The model attempts to harmonize the world of UPS by standardizing selected business processes and integrating operational flexibility at the point of SBU-level strategy.
While the rationale is simple and, in fact, straightforward, the multi-national nature of UPS’s business increases the complexity in implementation and creates the potential for a negative surprise for the investment community in the near term. The steadfast faith of investors in UPS, the air cargo integrator, is primarily attributable to the adjusted operating margins of the company (demonstrating that service quality and customer retention are not compromised in the process).
The Dividend Is Attractive, but Cash Coverage Matters
UPS has attractive dividends. However, I am more interested in the cash coverage of its dividends. The relevant issue is current 2026 coverage rather than fiscal 2020/2021. UPS expects about $5.4 billion in dividend payments in 2026, subject to board approval, while free cash flow has been close to the dividend requirement rather than comfortably above it.
Currently, UPS's annual dividend is $6.56, making its quarterly dividend $1.64, which is an attractive dividend yield at the current share price. At the closing price of $93.74, the forward dividend yield is 7.0%. Dividend yields this high make an attractive addition to total shareholder returns. The yield itself is not a “cash flow dividend yield”; it is simply the annual dividend divided by the share price. The cash-coverage question is whether recurring free cash flow can comfortably fund the roughly $5.4 billion annual payout. The company expects $5.4 billion in dividend payouts, and expects to spend $3.0 billion in capex, in 2026.
Over the past years, UPS has paid dividends greater than its free cash flows, which is why the dividend yield is more representational of the cash flow dividend yield. More precisely, the dividend has at times consumed most or all of UPS’s free cash flow, so investors should focus on payout coverage rather than the yield label itself. The focus, however, should be on the cash flows rather than the dividends. Raising UPS's dividend yield and having a cash generation system in place to sustain the payout provides a margin of safety.
2026 Guidance Points to a Better Earnings Base
UPS forecasts revenue for 2026 to be approximately $91.2 billion, and forecasts its operating profits to be approximately $8.65 billion, which would result in diluted EPS of approximately $7.22. These figures are non-GAAP adjusted guidance. According to these forecasts, UPS is trading at approximately a 13.0 times multiple of earnings. With the multiple being this low, the dividend yield being this high would typically mean an attractive buy. There is, however, uncertainty surrounding the durability of UPS's operating margins and dividends. With UPS being a cash flow dividend stock, as the cash flows slow, the multiple would likely have to contract.
Peak Season Is the Next Real Operating Test
The peak holiday season will provide important early evidence on the health of UPS's newly reengineered air and ground networks. UPS must be able to demonstrate to its satisfaction that various cost cutting measures including peak season demand surcharges, reductions in its air package return volumes, and organizational changes to its air network management have improved the economics of its business. This will be the first peak season after the Amazon glide-down and related network reconfiguration were completed in June. Given the recent reconfigurations of the air network by UPS and the coincident shift of air packages by Amazon to ground, this year's peak season provides a good baseline to evaluate the impact of recent changes. Improvements in operating margins are likely. The key will be to evaluate whether service levels also improved.
UPS Technical Analysis: UPS Breaks Rising Trendline as $91.72 Support Comes Into Focus
UPS stock recently broke a multimonth upward-trending line and both moving averages and closed most recently at $93.74. Based on the breaking of the upward-trending line and the moves below $98.73, I am of the opinion that the larger trend for UPS is still bearish.
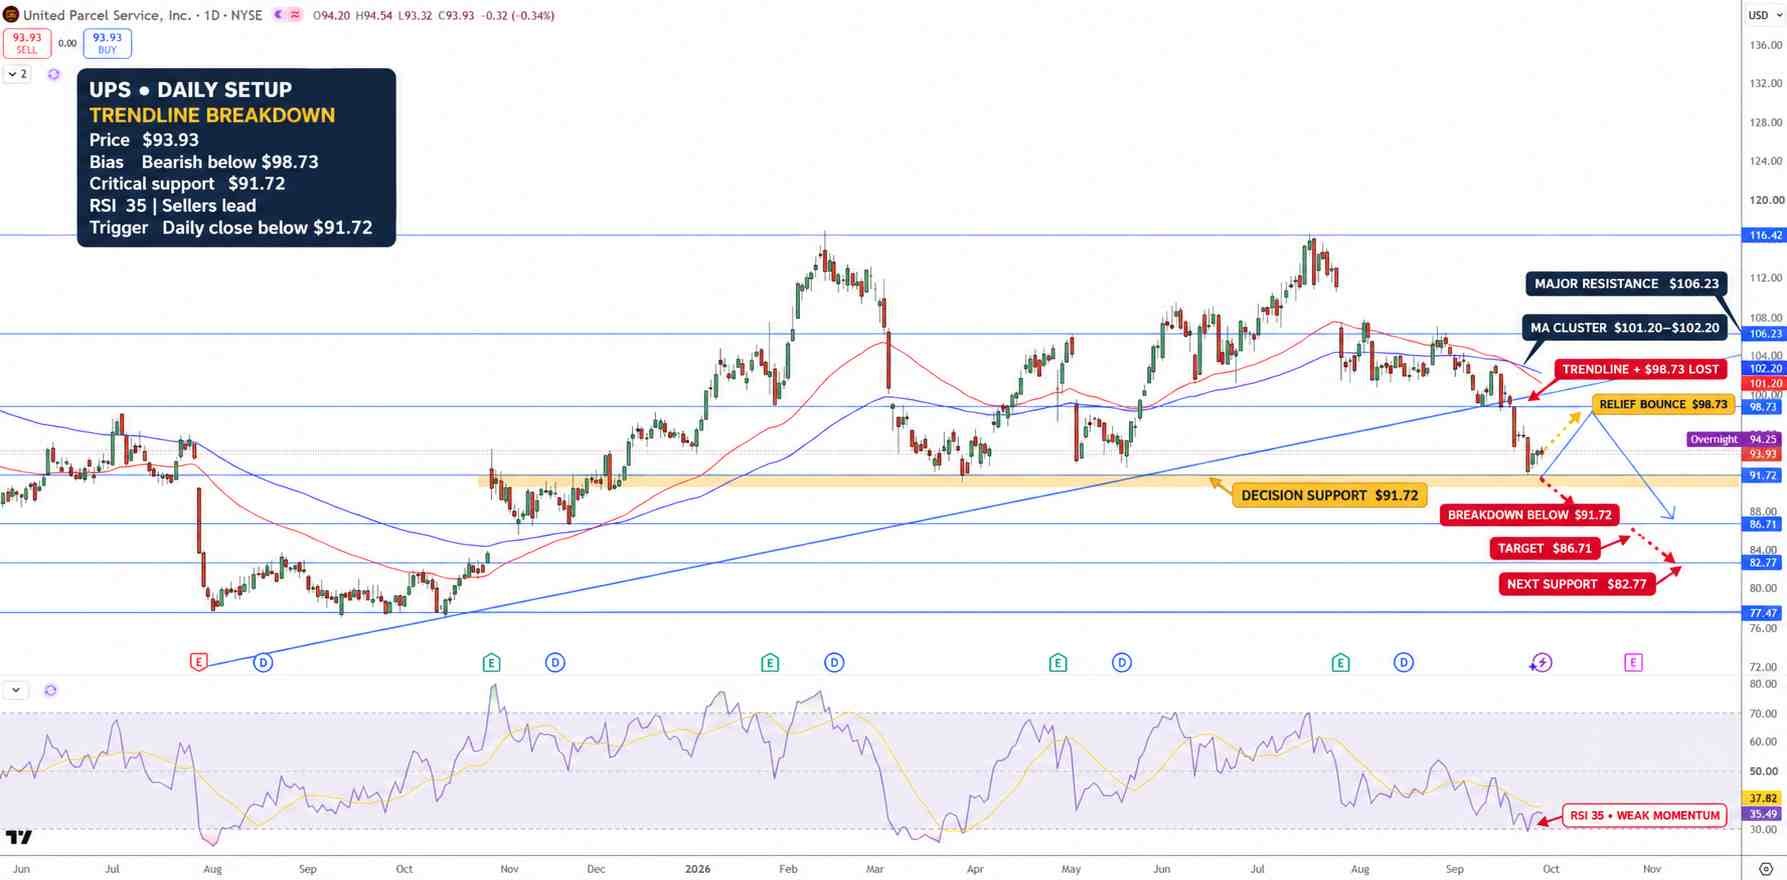
UPS Stock Price Chart - Source: Tradingview
Currently, UPS is trading at a support level at $91.72, and the relative strength index (RSI) is at 35, with the moving average at 38. The RSI indicates that the $91.72 support level is still intact and is currently considered a “sellers’ market,” but the proximity to the oversold level indicates that a small relief bounce is possible.
The upper endpoint of the recently tested support level at $98.73 would be considered the first major upward resistance. Beyond that, the moving-average resistance cluster would come into play at $101.20 to $102.20 and beyond that $106.23. The 200 day moving average also comes into play at that level. Overall, I remain bearish on UPS as long as it trades below $98.73.
Key Levels
• Latest completed close: $93.74
• Major support: $91.72, $86.71 and $82.77
• Major resistance: $98.73, $101.20-102.20 and $106.23
• RSI: about 35; bearish, approaching oversold
• Potential downside: $86.71 from a breakdown below $91.72
Why is UPS stock in focus now?
Amazon’s volume reset is complete and UPS has a new global operating model. Additionally, UPS is likely to see an increase in volume during the Holidays given the surge in shipping costs. More precisely, investors are testing whether peak-season demand surcharges and the completed network reset can improve revenue quality, margins and cash flow even if overall package demand remains soft.
What level confirms a stronger UPS recovery?
A Daily closing above $98.73 would give further confidence in the bullish case and possibly target the resistance zone between $101.20 and $102.20. The bearish case would be targeted if support if $91.72 is broken, and would extend to $86.71.
Bottom Line
While some aspects of UPS's business improvement plan are now complete, the stock continues to trade at a largely skeptical valuation. In the recent quarter, earnings were better than expected and guidance was raised. The Amazon volume glide-down and related network reconfiguration are now complete, but the economic benefits still need to show up consistently in future results. The main concern remains cash flow. UPS has a high dividend yield around 7%, but free cash flow and reported earnings need to improve to support the dividend. Free cash flow can be improved by taking cost reducing actions. UPS trades for a low earnings multiple rather than a high valuation, and would therefore be considered bearish below $98.73. There could be support at $91.72 and a break below that could lead to further losses at $86.71.
Recommended Articles


