


Yen touches 158.37 as Tokyo reopens, then slips back — ¥15.4 trillion of intervention and the 200-day line stand between here and 160


Mitrade Insights — The yen has run into a wall built out of its own central bank's money. USD/JPY touched 158.37 overnight — its highest level since early September — before easing back to 157.88 as Japanese markets reopened on Thursday after a three-day holiday. The 200-day moving average sits at 158.43, and the Ministry of Finance has already spent a record ¥15.4 trillion defending the currency since late July. So the question is no longer whether Tokyo will act, but whether a rate gap still north of 250 basis points makes any intervention stick.
The move
Japan's markets were shut from September 21 to 23. Trading resumed Thursday with the Nikkei 225 opening 0.69% higher (+446 points) at 65,465.06, while the currency pair had spent those three thin sessions grinding higher offshore.
| USD/JPY — key reference levels | Level |
|---|---|
| September 23 intraday high | 158.39 |
| September 24 intraday high | 158.37 |
| 200-day moving average | ~158.43 |
| Asia price on September 24 | ~157.88 (−0.29%) |
| 160.00 | psychological level, intervention watch zone |
The dollar has now pushed the yen to the doorstep of its 200-day average without managing a single close above it since early September. In a holiday-thinned market that is a very different thing from an actual break.
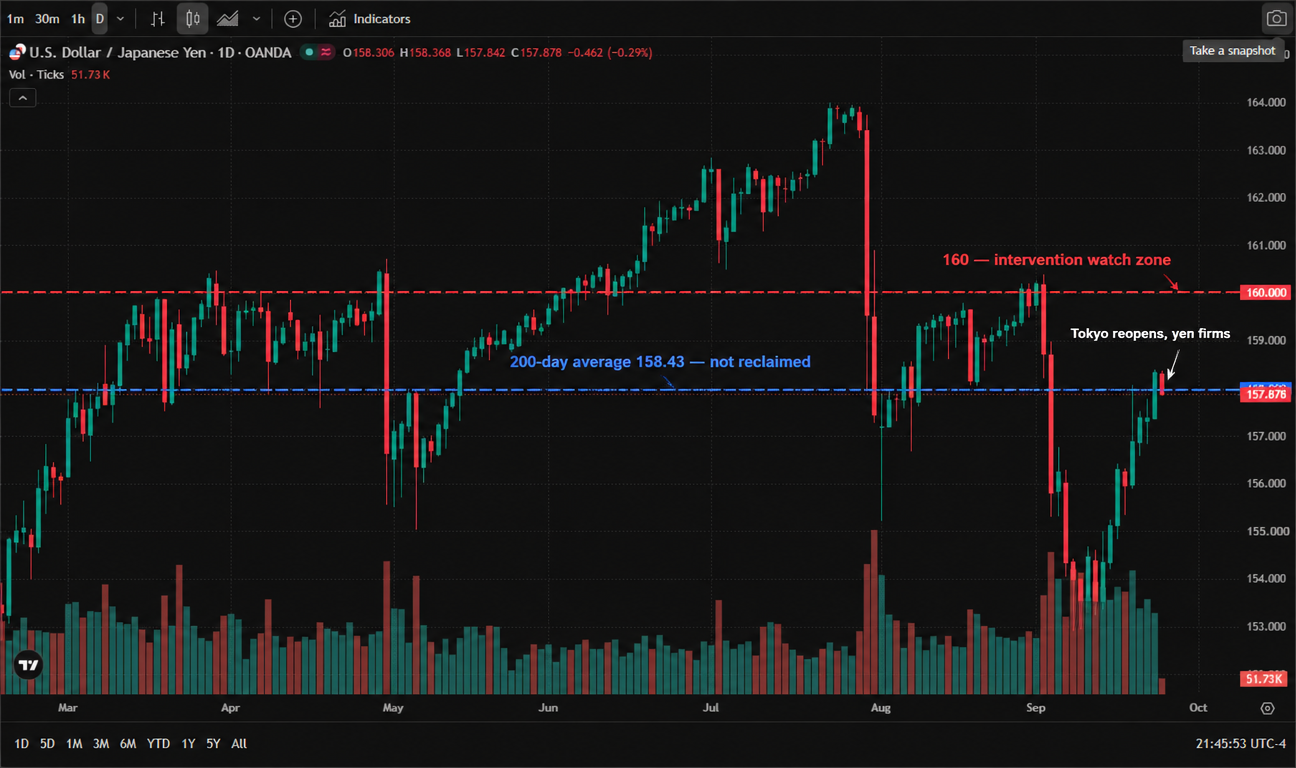
* Chart source: official TradingView screenshot (OANDA:USDJPY).
Why the yen is still weak
Three forces explain why a hiking central bank still has a falling currency:
The hike is fully priced. The Bank of Japan raised its policy rate 25 basis points to 1.25% on September 18 — the highest since 1995 — but the vote was 7–2 (Asada and Sato dissenting) and the statement gave no clear guidance on the pace from here.
Markets do not believe the next one. Rate markets assign only about 30% odds to a move to 1.50% in October, against roughly 90% by December. A slow path means the rate gap barely narrows.
The gap is still enormous. The Fed's target range sits at 3.75%–4.00% after its September 16 hike, more than 250 basis points above Japan's 1.25%. Carry trades remain economically rational.
The dollar side of the equation got its own push this week: US September flash PMIs came in far above expectations, sending the 10-year Treasury yield to its highest since July 2007 and lifting the dollar index to a two-month high near 101.
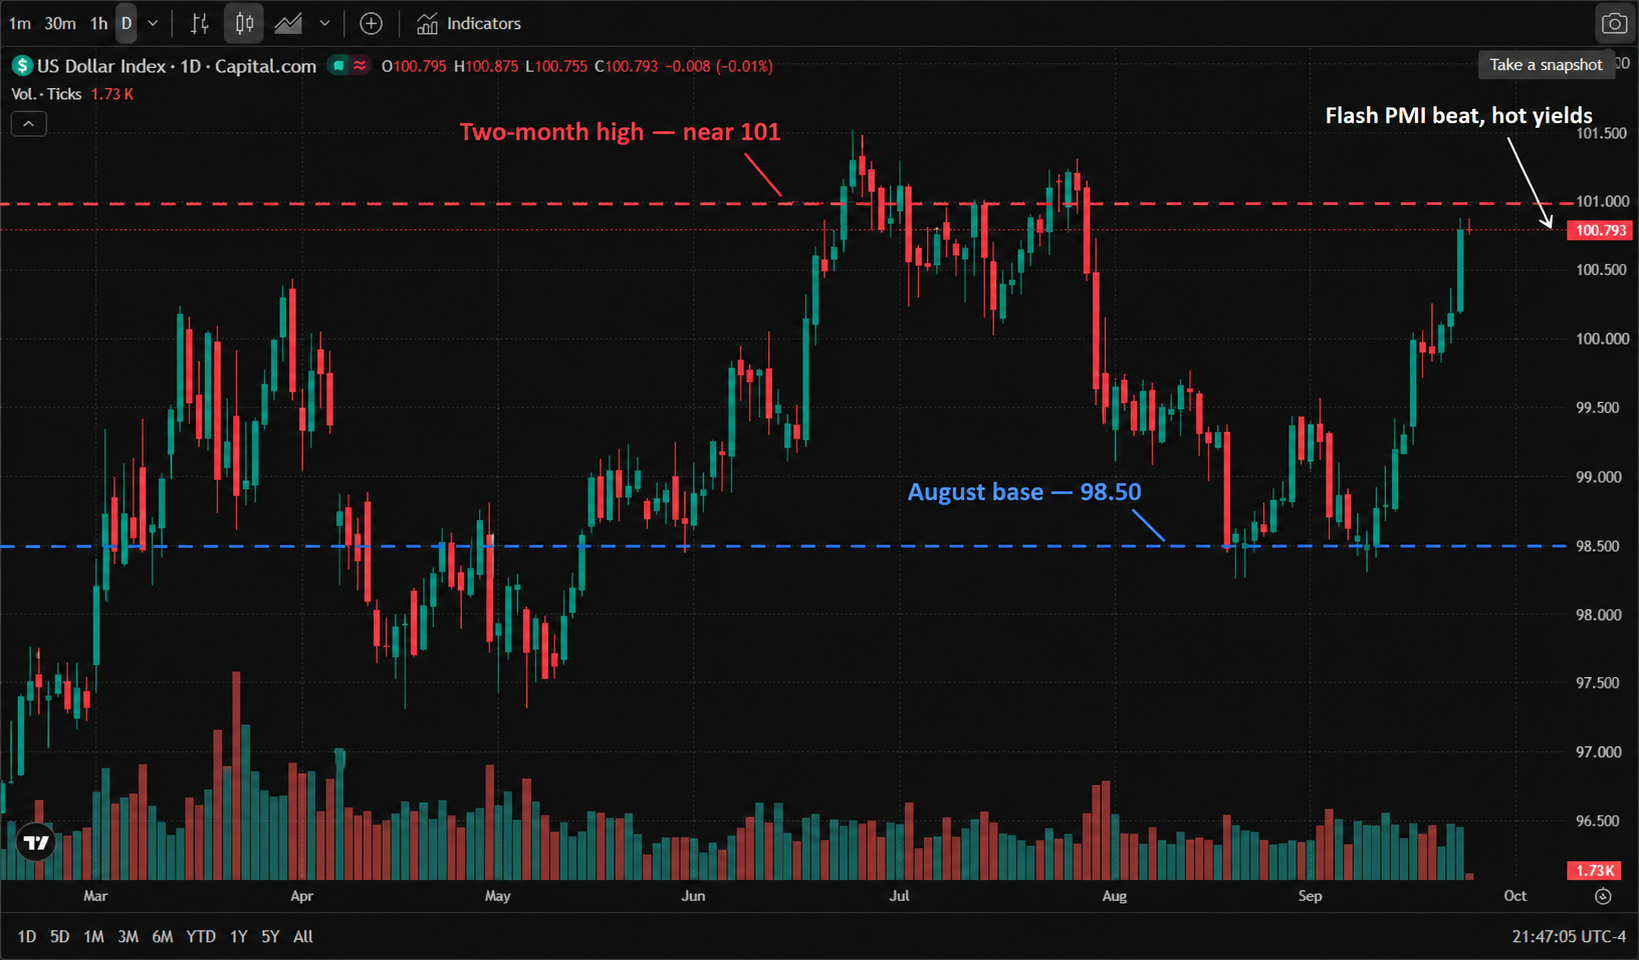
* Chart source: official TradingView screenshot (Capital.com:DXY).
¥15.4 trillion, and a rate check
The Ministry of Finance bought ¥15.4 trillion between July 30 and August 26 — the largest single-month intervention on record, exceeding the ¥11.7 trillion spent in April and May. On July 31 the US Treasury joined the operation, the first joint yen-buying action by the two countries since 1998.
That held USD/JPY below 160 for roughly four weeks. It did not change the direction. And on September 18 the Bank of Japan conducted a "rate check" — the same step that preceded the July intervention, which desks read as a preparatory signal rather than a coincidence.
Levels
| Pair | Resistance | Support |
|---|---|---|
| USD/JPY | 158.43 (200-day) / 159.00 / 160.00 (intervention zone) | 157.84 (Sep 24 low) / 156.86 (Sep 21 level) |
| AUD/JPY | 112.85 (100-day) / 113.38 (July high) | 110.00 (round number) / 109.67 (Sep 14 low) |
AUD/JPY — the carry pair Australian and Asian desks watch most closely — slipped to 110.97 on Thursday, within a yen of its September 14 low, after Australia's August unemployment rate rose to 4.6%, the highest since late 2021. That number landed just four days before the RBA decision on September 28–29, where a hike to 4.60% is still around 90% priced.
What to watch, and two scenarios
Tonight brings US initial jobless claims (consensus around 201K, prior 196K) plus another round of Fed speakers. Next week belongs to the RBA on September 28–29 and then the FOMC on October 27–28, where markets now price roughly 70% odds of another 25bp hike.
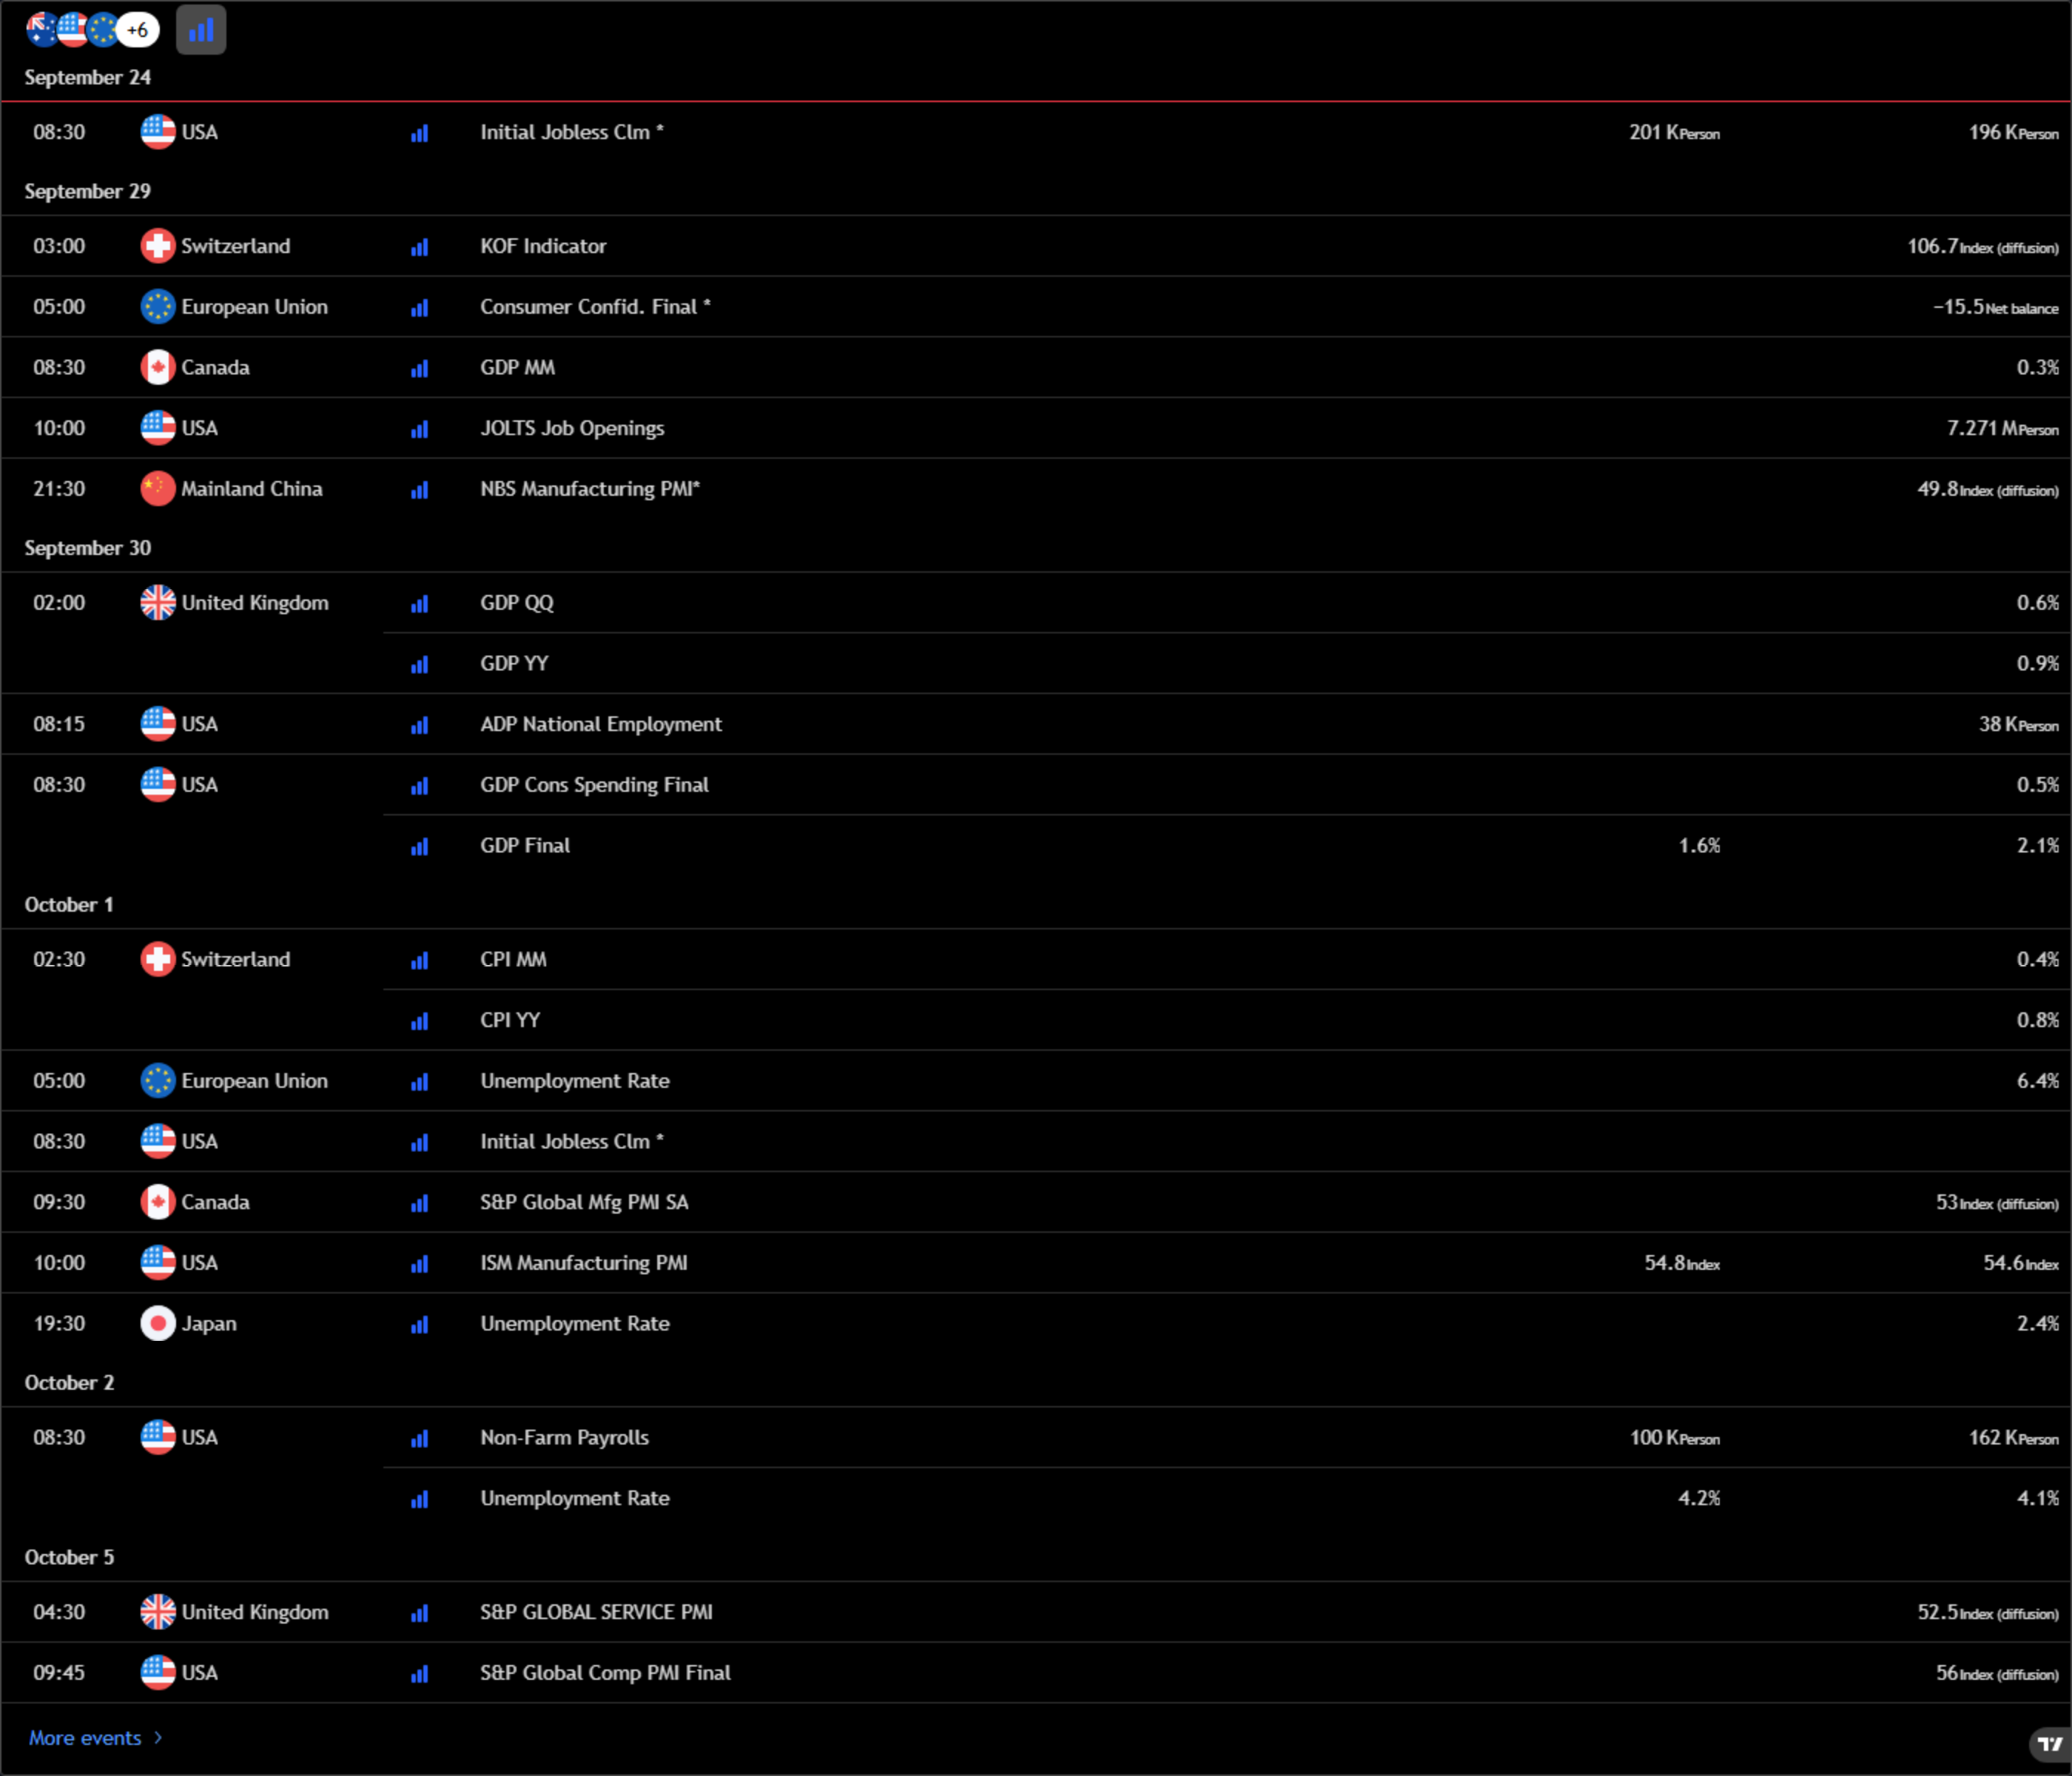
* Chart source: official TradingView economic calendar widget.
Scenario A — Tokyo intervenes again. If USD/JPY pushes into 159.00–160.00 during Tokyo hours, the probability of an MoF operation rises sharply. The July precedent suggests it would land in a thin liquidity window and produce a 2–3 yen single-day drop, dragging AUD/JPY down toward 110.00 and possibly 109.67. This is a risk to yen shorts, not a trend change.
Scenario B — the rate gap reasserts itself. If tonight's claims stay firm and Fed speakers hold the hawkish line, the carry logic takes over again. USD/JPY closes above 158.43 and targets 159.00; AUD/JPY lags on weaker Australian data and chops between 110 and 112.
Read more
* The content presented above, whether from a third party or not, is considered as general advice only. This article should not be construed as containing investment advice, investment recommendations, an offer of or solicitation for any transactions in financial instruments.


