


Gold Price Forecast: US August PCE Imminent, Will Gold Prices Rise or Fall Short-Term?


TradingKey - As of the European session on September 30, gold prices (XAUUSD) continued to recover after a sharp drop earlier this week, reclaiming $4,200 intraday, with the latest price trading near $4,195. Gold prices had previously fallen to a seven-week low near $4,110, with a cumulative decline of nearly 6% since September. As the U.S. August PCE inflation data is about to be released, short-term market focus has shifted back to inflation and the Federal Reserve's subsequent rate-hike path.
How Will PCE Impact Gold Trends?
The U.S. Bureau of Economic Analysis will release August personal consumption expenditures (PCE) data on Wednesday at 8:30 a.m. ET.
According to July data, headline PCE rose 3.7% year-over-year in July, while core PCE climbed 3.3% year-over-year, both well above the Federal Reserve's 2% inflation target.
Markets currently expect both headline and core PCE to rise 0.3% month-over-month in August. Against the backdrop of the Federal Reserve's 25-basis-point rate hike in September, whether inflation remains sticky will directly influence market expectations regarding further rate hikes in October and by the end of the year. Current market pricing shows a 42.6% probability of another rate hike in October, while expectations for another hike before December remain elevated.
From a market perspective, if core PCE comes in below expectations, market pricing for subsequent rate hikes could cool further, putting downward pressure on U.S. Treasury yields and the U.S. dollar, while gold prices may extend their current recovery. Conversely, if PCE prints above expectations again, the market could raise the probability of an October rate hike, and gold could retest this week's lows.
Gold Price Technical Analysis
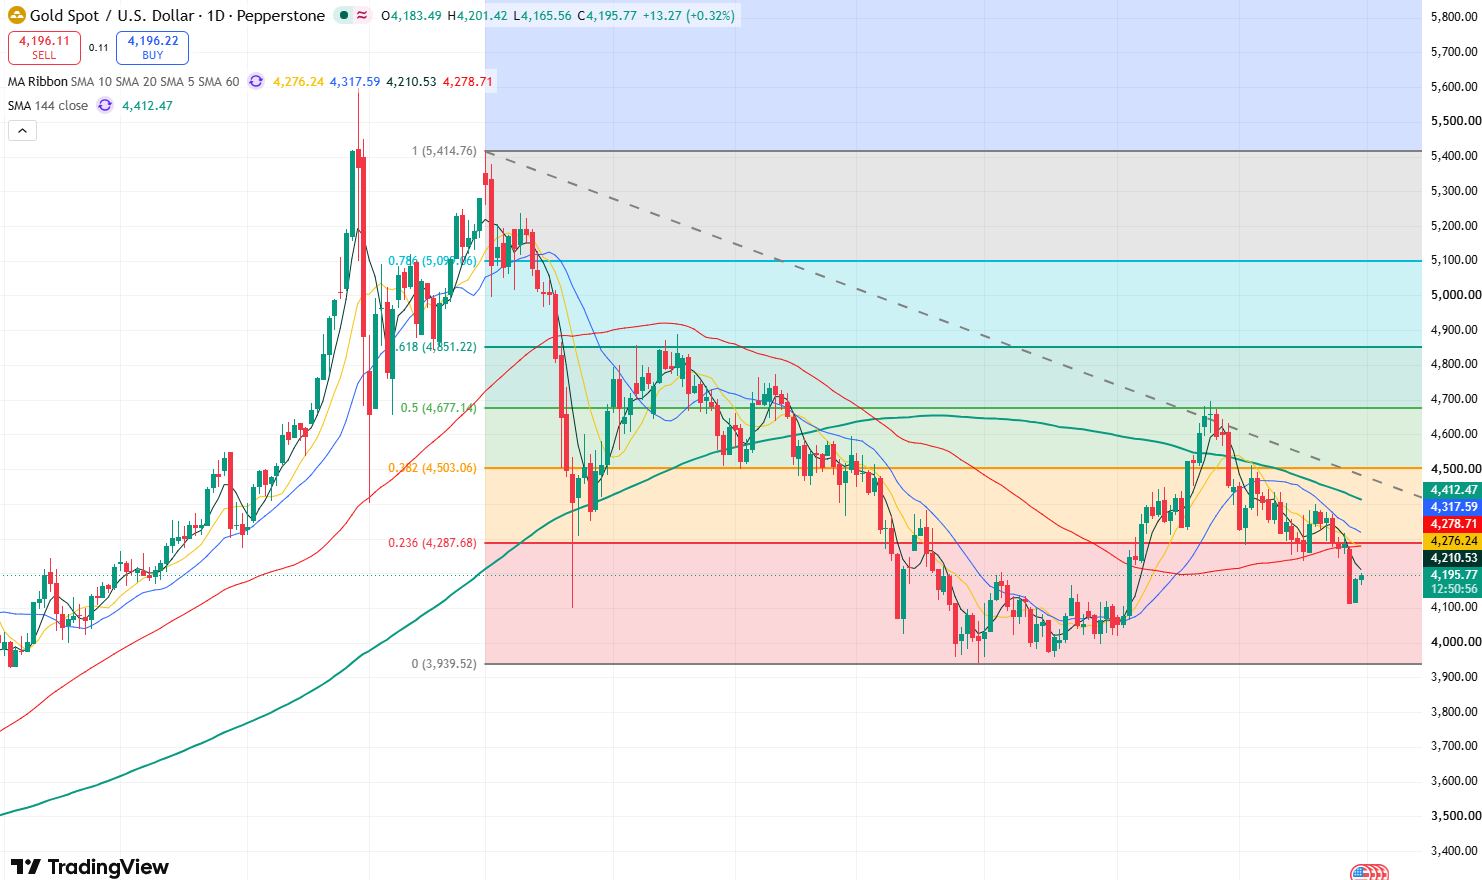
Gold price daily chart, Source: TradingView
Looking at the daily chart of gold prices, gold opened lower this Monday and remained down during the day, dropping directly below $4,200 and briefly falling near $4,100. However, gold rebounded quickly after dropping near $4,100 and briefly rose above $4,200 today, indicating that a short-term oversold recovery has emerged and bullish market sentiment has somewhat improved.
In terms of technical indicators, the RSI indicator is near 41, remaining in neutral-to-weak territory, which indicates that gold prices could still decline in the short term.
On the upside, the primary resistance level to watch is near the 5-day moving average at $4,210. If gold can break and hold above this level, it will further test the resistance zone of $4,250-$4,300; if gold can strongly hold above $4,300, it will open up upside room toward $4,400, with potential to test the resistance level at $4,510.
On the downside, the primary support level to watch is $4,100. If this level is lost, gold prices may further test the $4,000 mark downward, and could even break below $4,000 to pull back toward $3,900.
Read more
* The content presented above, whether from a third party or not, is considered as general advice only. This article should not be construed as containing investment advice, investment recommendations, an offer of or solicitation for any transactions in financial instruments.


