

Dogecoin Price Forecast: Nears pivotal resistance as ETF inflows contrast with cautious on-chain signals

Source Fxstreet
  • Dogecoin trades above $0.092 on Tuesday, nearing the key 200-day EMA at $0.094, which could determine the next move.
  • US-listed spot ETF recorded an inflow of $146,020 on Monday, signaling renewed investor interest.
  • On-chain and derivatives data show cautious signals, with whale selling and rising short positions suggesting increased downside pressure.

Dogecoin (DOGE) is approaching the key technical level around $0.094 on Tuesday, which could determine DOGE’s next move. Institutional demand shows mild strength, as spot Exchange Traded Funds (ETFs) recorded positive flows on Monday. Meanwhile, on-chain and derivatives metrics point to caution after the meme coin’s massive 34% rally last week.

Institutional demand shows signs of optimism

Institutional demand for Dogecoin shows early signs of return. SoSoValue data showed spot Exchange Traded Funds (ETFs) recorded a $146,020 inflow on Monday, following a $653,420 inflow in the previous week, signaling renewed investor interest. If this trend continues and intensifies throughout the week, Dogecoin could extend its rally.
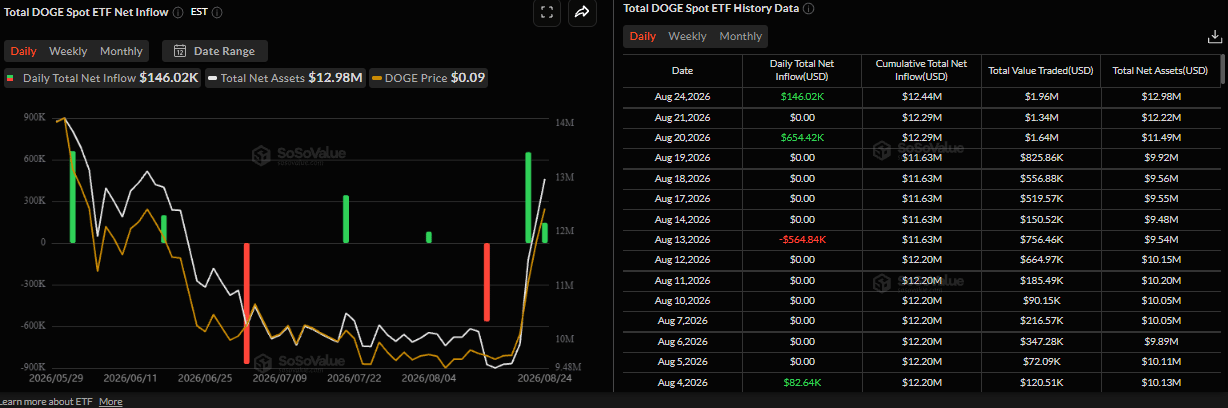
Total DOGE spot ETF net inflow daily chart. Source: SoSoValue

Some signs of concern

Santiment’s Supply Distribution data shows that large-wallet holders (whales) are steadily offloading tokens, a move that could increase the near-term selling pressure.

The metric indicates that 10 million and 100 million DOGE tokens (blue line) and 1 million and 10 million (yellow line) have collectively reduced their holdings by 280 million DOGE since Friday.

Dogecoin supply distribution metric chart. Source: Santiment

The bearish thesis strengthened as the long-to-short ratio for the meme coin remained below 1, reading 0.93 on Tuesday and nearing the lowest level in over a month. A ratio below one indicates that traders are betting the asset price will fall.
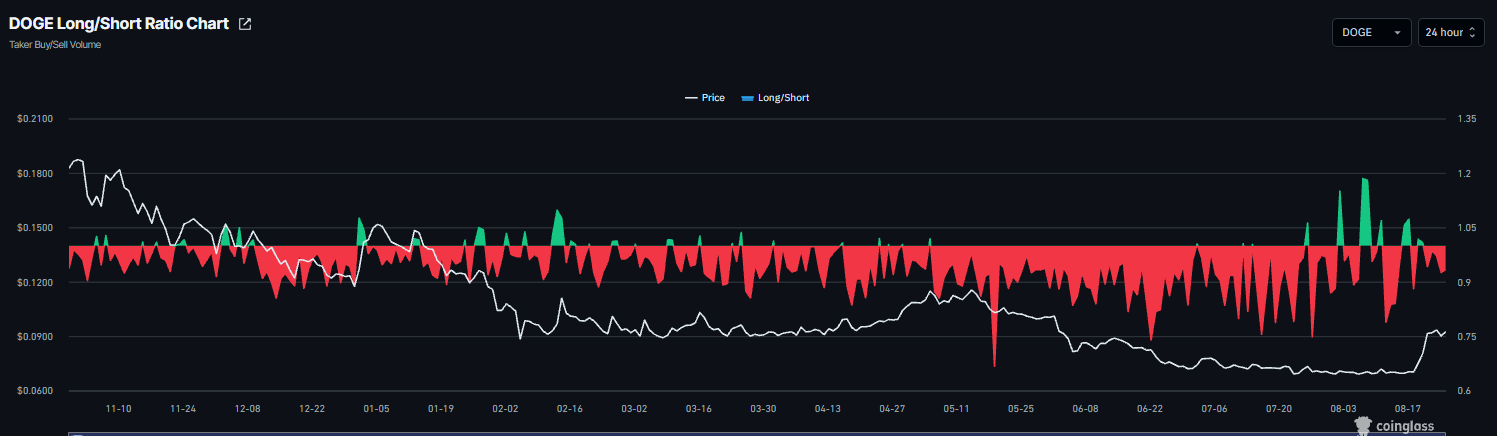
Dogecoin long-to-short ratio chart. Source: Coinglass

Dogecoin technical outlook: DOGE nears key 200-day EMA

Dogecoin price trades at $0.092 on Tuesday after surging over 34% in the previous week. DOGE is holding a bullish near-term bias as it sits above the 50-day and 100-day Exponential Moving Averages (EMAs) at roughly $0.076 and $0.081, respectively, and well above the reclaimed downtrend resistance line now acting as support near $0.070.

Momentum is stretched, with the Relative Strength Index (RSI) hovering deep in overbought territory near 77 and the Moving Average Convergence Divergence (MACD) histogram positive and elevated, suggesting the rally could face consolidation even as buyers retain control while spot holds above the $0.088 support band.

On the downside, initial protection emerges at the horizontal level around $0.088, ahead of layered dynamic support at the 100-day EMA near $0.081 and the 50-day EMA around $0.076, with the former resistance trendline break near $0.070.

On the topside, immediate resistance is seen at the 200-day EMA around $0.094, with a subsequent barrier at the horizontal cap near $0.102; a daily close above this latter level would strengthen the bullish structure and open the door to further gains, whereas repeated failure below it would hint at a maturing upswing.
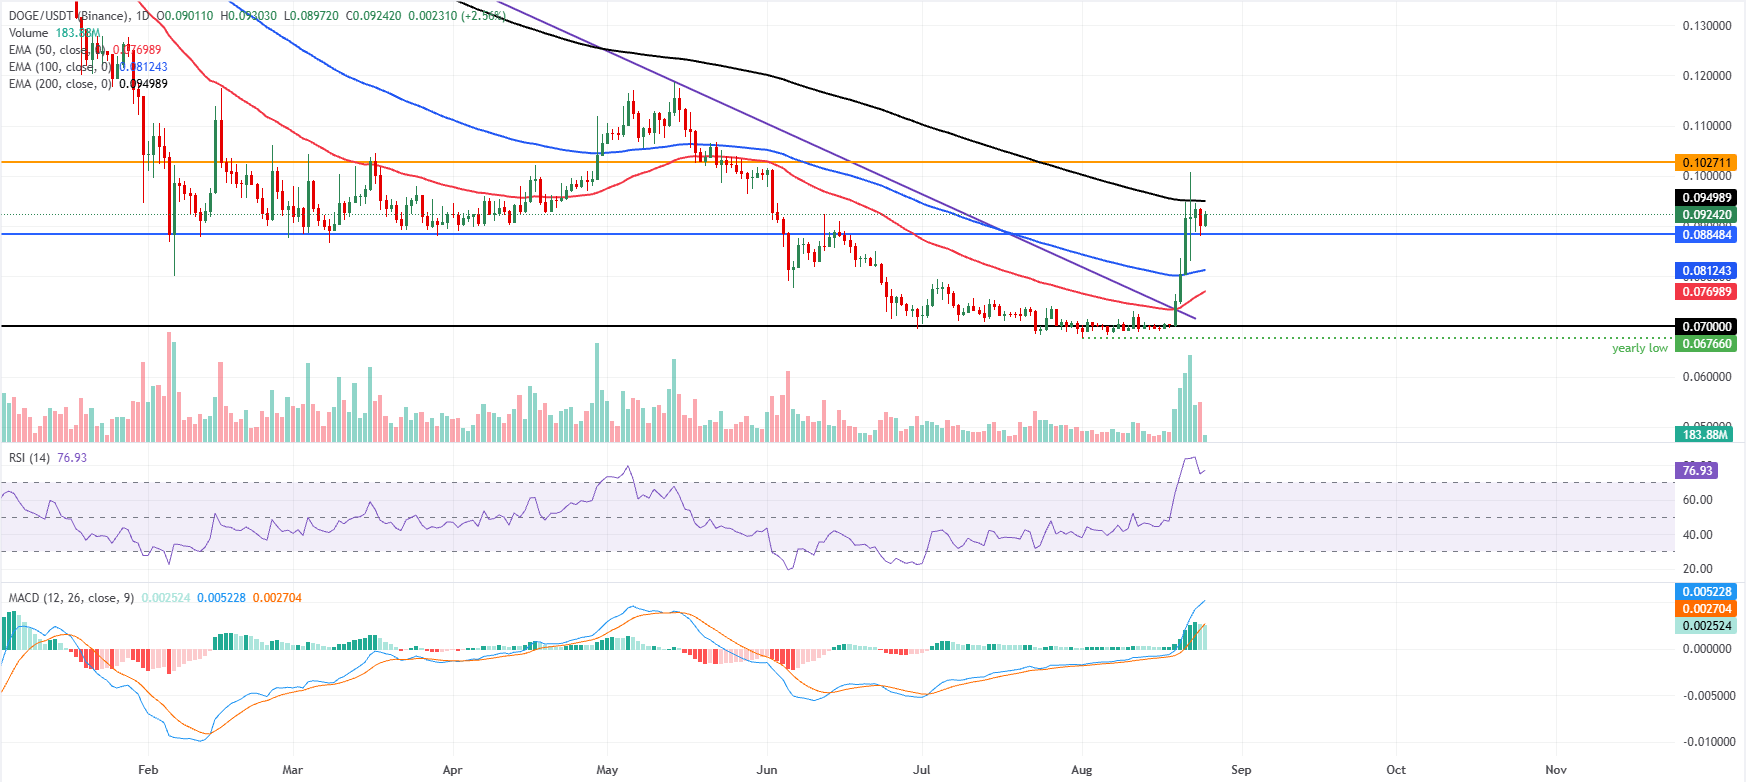
DOGE/USDT daily chart

(The technical analysis of this story was written with the help of an AI tool. Know more.)

Disclaimer: For information purposes only. Past performance is not indicative of future results.
placeholder
Gold ends three-week slide at the $4,400 line — eight straight days of ETF inflows vs a 5% 10-year and a 100 dollarSpot gold closed Friday at $4,378.39, up 0.84% on the day and about 0.8% for the week — its first weekly gain in four weeks — with the intraday high of $4,399.67 leaving it 33 cents shy of the $4,400 line. Gold ETFs have now logged eight straight sessions of inflows, but with the 10-year back above 5% and the dollar index near 100, here is what decides whether this is a reversal or a bounce.
Author  Suzie
Sep 20, Sun
Spot gold closed Friday at $4,378.39, up 0.84% on the day and about 0.8% for the week — its first weekly gain in four weeks — with the intraday high of $4,399.67 leaving it 33 cents shy of the $4,400 line. Gold ETFs have now logged eight straight sessions of inflows, but with the 10-year back above 5% and the dollar index near 100, here is what decides whether this is a reversal or a bounce.
placeholder
October hike odds climb toward 60% as Goldman and BofA both flip — what Warsh's "dose of accommodation" really changedRate futures now price roughly 55% to 62% for a 25bp hike at the October 27-28 FOMC, up from about 30% before Chair Warsh's post-meeting framing that the Fed is merely "removing some accommodation." Goldman Sachs has added an October hike to its forecast and Bank of America now sees moves in both October and December. Here is the repricing, the language behind it, and the two data points that decide it.
Author  Irene Q.
Sep 23, Wed
Rate futures now price roughly 55% to 62% for a 25bp hike at the October 27-28 FOMC, up from about 30% before Chair Warsh's post-meeting framing that the Fed is merely "removing some accommodation." Goldman Sachs has added an October hike to its forecast and Bank of America now sees moves in both October and December. Here is the repricing, the language behind it, and the two data points that decide it.
placeholder
Gold holds steady below $4,150 amid elevated US yields Gold price (XAU/USD) trades on a flat note near $4,140 during the early Asian session on Tuesday. Pressure from a stronger US Dollar (USD) and elevated US Treasury yields was offset by reduced expectations of a Federal Reserve (Fed) rate hike this month.
Author  FXStreet
Oct 06, Tue
Gold price (XAU/USD) trades on a flat note near $4,140 during the early Asian session on Tuesday. Pressure from a stronger US Dollar (USD) and elevated US Treasury yields was offset by reduced expectations of a Federal Reserve (Fed) rate hike this month.
placeholder
WTI rises to near $89.50 as Middle East supply threats offset Persian Gulf recoveryWest Texas Intermediate (WTI) oil price extends its gains for the second successive day, trading around $89.50 per barrel during the Asian hours on Wednesday. Crude oil climbed as persistent risks to Middle East energy flows overshadowed signs of rising supply from the region.
Author  FXStreet
Yesterday 01: 26
West Texas Intermediate (WTI) oil price extends its gains for the second successive day, trading around $89.50 per barrel during the Asian hours on Wednesday. Crude oil climbed as persistent risks to Middle East energy flows overshadowed signs of rising supply from the region.
placeholder
Gold Price Forecast: XAU/USD retraces gains and nears two-month lows at $4,104Gold (XAU/USD) retraces Tuesday’s gains on Wednesday and resumes its broader bearish trend, with the US Dollar (USD) appreciating across the board, as investors brace for the release of the minutes of the latest Federal Reserve (Fed) meeting.
Author  FXStreet
18 hours ago
Gold (XAU/USD) retraces Tuesday’s gains on Wednesday and resumes its broader bearish trend, with the US Dollar (USD) appreciating across the board, as investors brace for the release of the minutes of the latest Federal Reserve (Fed) meeting.
Related Instrument
goTop
quote