

Ripple and Stellar outlook: XRP slips, XLM rebound faces resistance amid mixed sentiment

Source Fxstreet
  • XRP remains under pressure, trading below $1.500 on Thursday and down 1.72% so far this week.
  • XLM extends its rebound, trading at $0.227 on Thursday after modest gains the previous day.
  • Rising US Treasury yields and mixed derivatives metrics continue to cap upside momentum for XRP and XLM.

Ripple (XRP) remains under pressure, slipping below $1.500 on Thursday while Stellar (XLM) extends its rebound, trading around $0.227 but facing resistance amid mixed market sentiment. Rising US Treasury yields and mixed derivatives metrics continue to weigh on risk appetite, leaving traders cautious for both tokens.

Soaring US yields weigh on risky assets

Crypto markets are being held back by the same force weighing on broader risk assets: soaring US Treasury yields. The 5-year yield has risen above 5%, while the 10-year yield is above 5.2%, with both at 19-year highs. Surging yields are pushing investors away from risk assets, stalling upside momentum for Ripple and Stellar. These higher yields make traditional fixed-income assets more attractive than riskier investments such as cryptocurrencies, capping XRP and XLM’s outlook.

Mixed derivatives cap upside

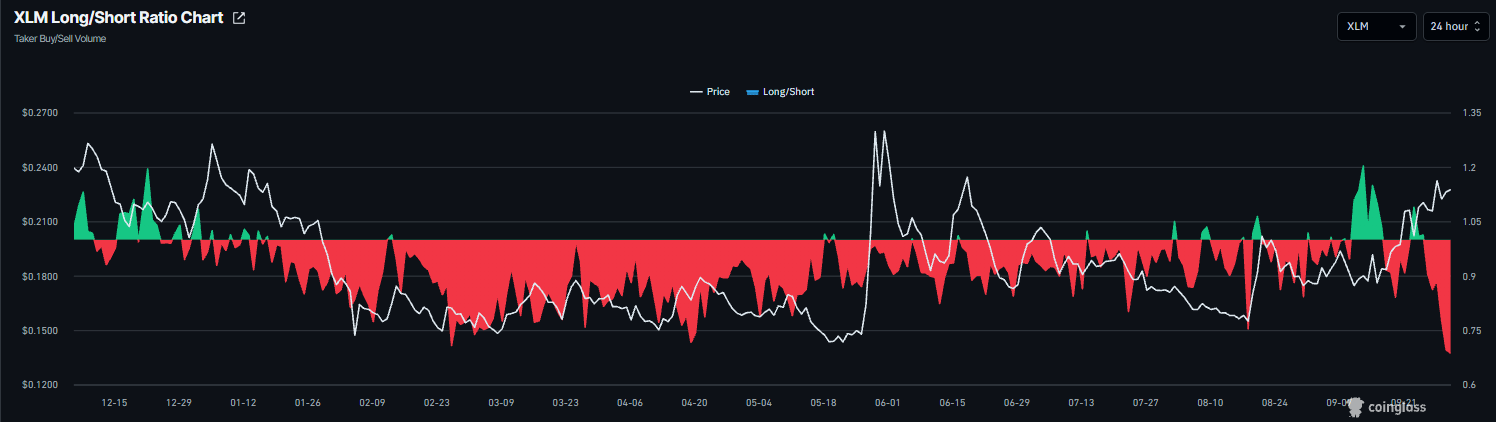
Derivatives data shows a mixed and cautious outlook among traders. CoinGlass’ long-to-short ratios for Ripple and Stellar read 0.85 and 0.68 on Thursday, nearing the lowest levels over a month. A ratio below one indicates bearish sentiment, as traders bet that asset prices will fall.
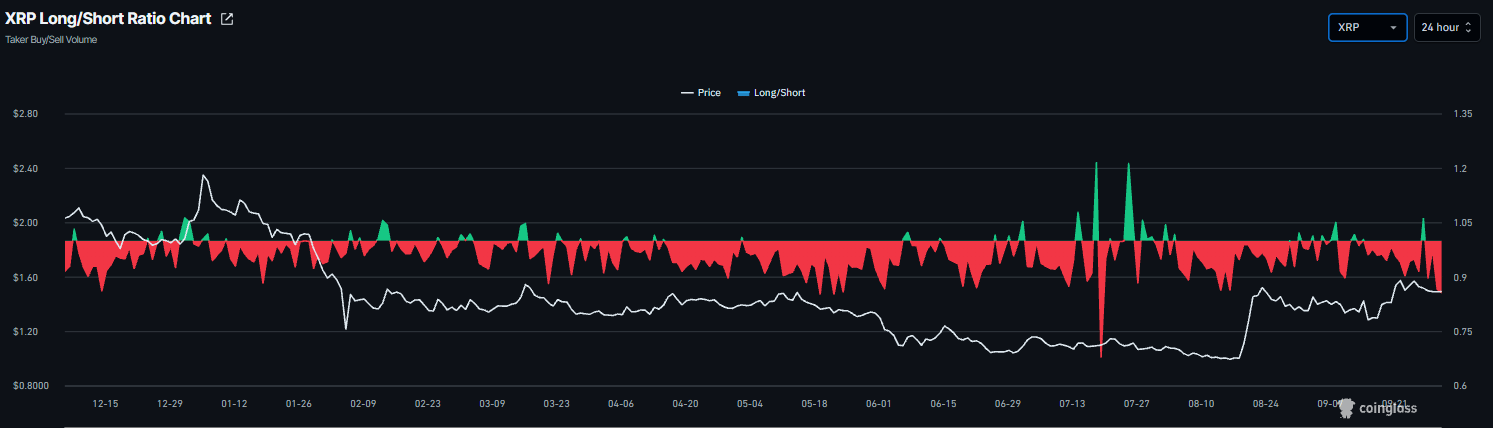
XRP long-to-short ratio chart. Source: Coinglass
XLM long-to-short ratio chart. Source: Coinglass

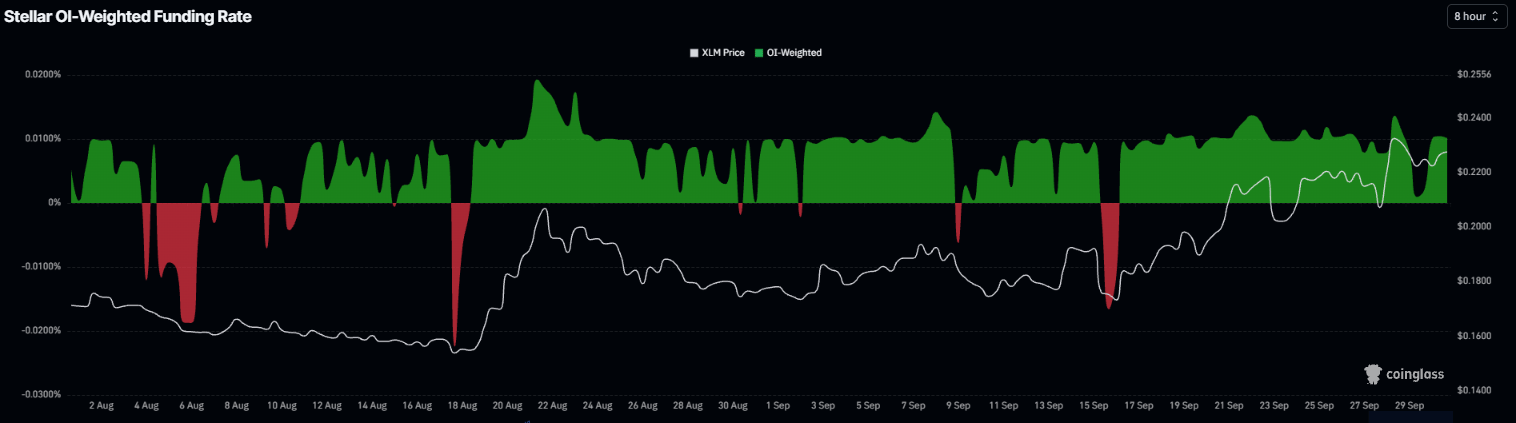
In addition, the XRP funding rate flipped positive on September 24, reading 0.0040% on Thursday. Similarly, the XLM funding rate flipped positive on September 14, reading 0.0100% on Thursday. These positive rates indicate longs are paying shorts, reflecting a bullish outlook.
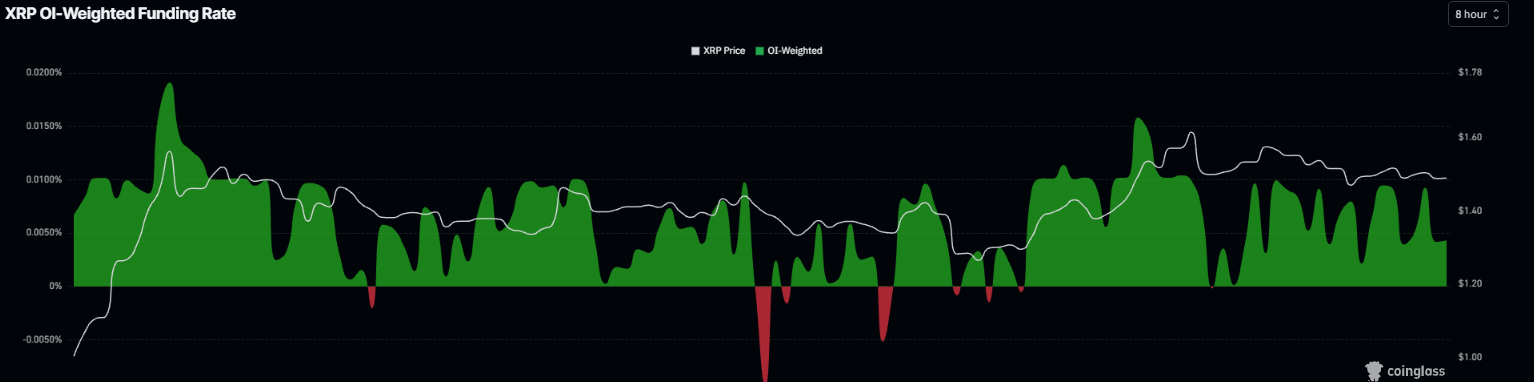
XRP funding rates chart. Source: Coinglass
XLM funding rates chart. Source: Coinglass

XRP technical outlook: Extends pullback

XRP price trades at $1.489 on Thursday after a slight correction so far this week. Despite this pullback, XRP remains bullish, holding well above the 50-day, 100-day, and 200-day Exponential Moving Averages (EMAs) clustered between roughly $1.376 and $1.314, which now underpin the broader uptrend.

The Relative Strength Index (RSI) at 55 stays comfortably above the neutral line, hinting at steady but not overextended buying pressure. At the same time, the Moving Average Convergence Divergence (MACD) indicator has slipped marginally below zero, suggesting that upside momentum is moderating after the recent advance rather than reversing decisively.

On the topside, initial resistance is seen at the horizontal barrier near $1.671, ahead of a stronger cap at $1.900, where fresh supply could emerge if bulls extend the rally.

On the downside, the 50-day EMA reinforces immediate support at $1.376 and the 200-day EMA at $1.371, with the 100-day EMA at $1.314 and the horizontal floor at $1.300 marking a deeper demand area; only a break below that zone would expose the more distant structural base around $1.000.
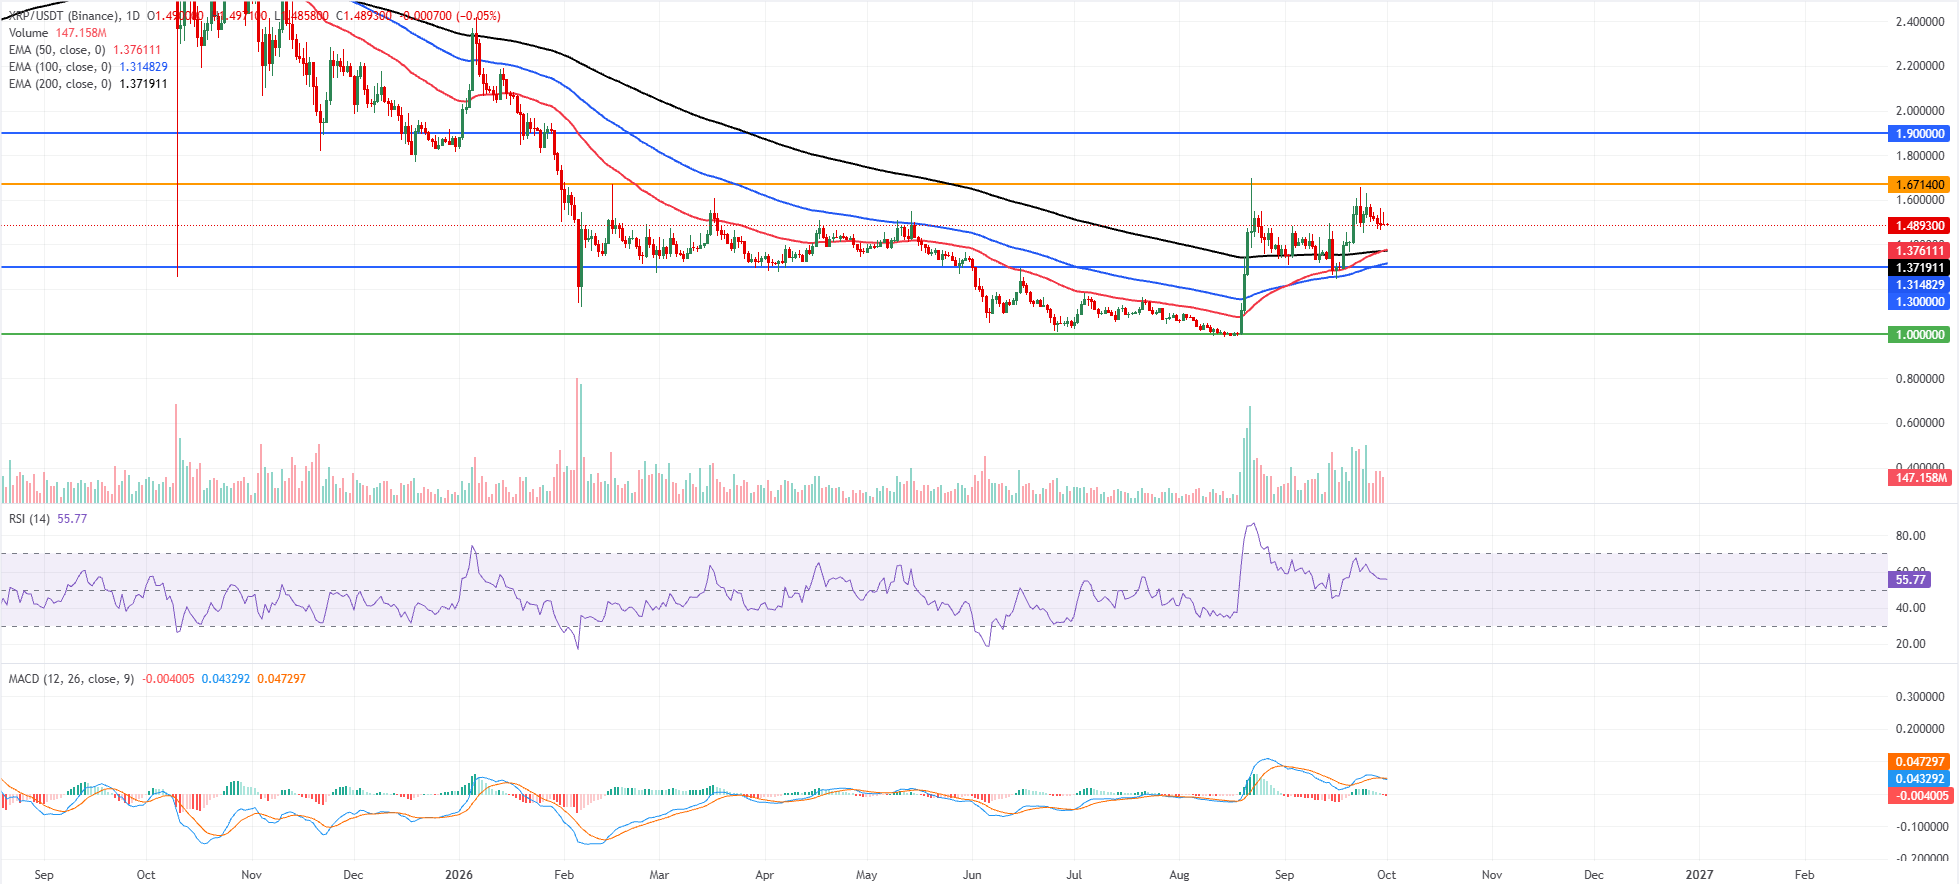
XRP/USDT daily chart

XLM technical outlook: Extends rebound

XLM price trades at $0.227 on Thursday after a slight rebound the previous day. XLM is sustaining a constructive bullish bias as price holds above the 50-day, 100-day, and 200-day EMAs clustered between roughly $0.188 and $0.195. This reclaim of the medium- and long-term EMAs, backed by a firm RSI near 63 and a positive MACD reading, suggests buyers remain in control as upside momentum builds.

On the downside, initial support aligns at the 50% retracement at $0.219, with the 61.8% Fibonacci retracement at $0.200 and the EMA cluster around $0.195–$0.191 reinforcing a broader demand zone before deeper horizontal support levels emerge at $0.177 and $0.142.

On the topside, immediate resistance is seen at the 38.2% Fibonacci retracement at $0.237, followed by the 23.6% Fibonacci retracement at $0.261 and the descending trendline resistance near $0.260, a confluence that may cap the advance unless buyers push through decisively.
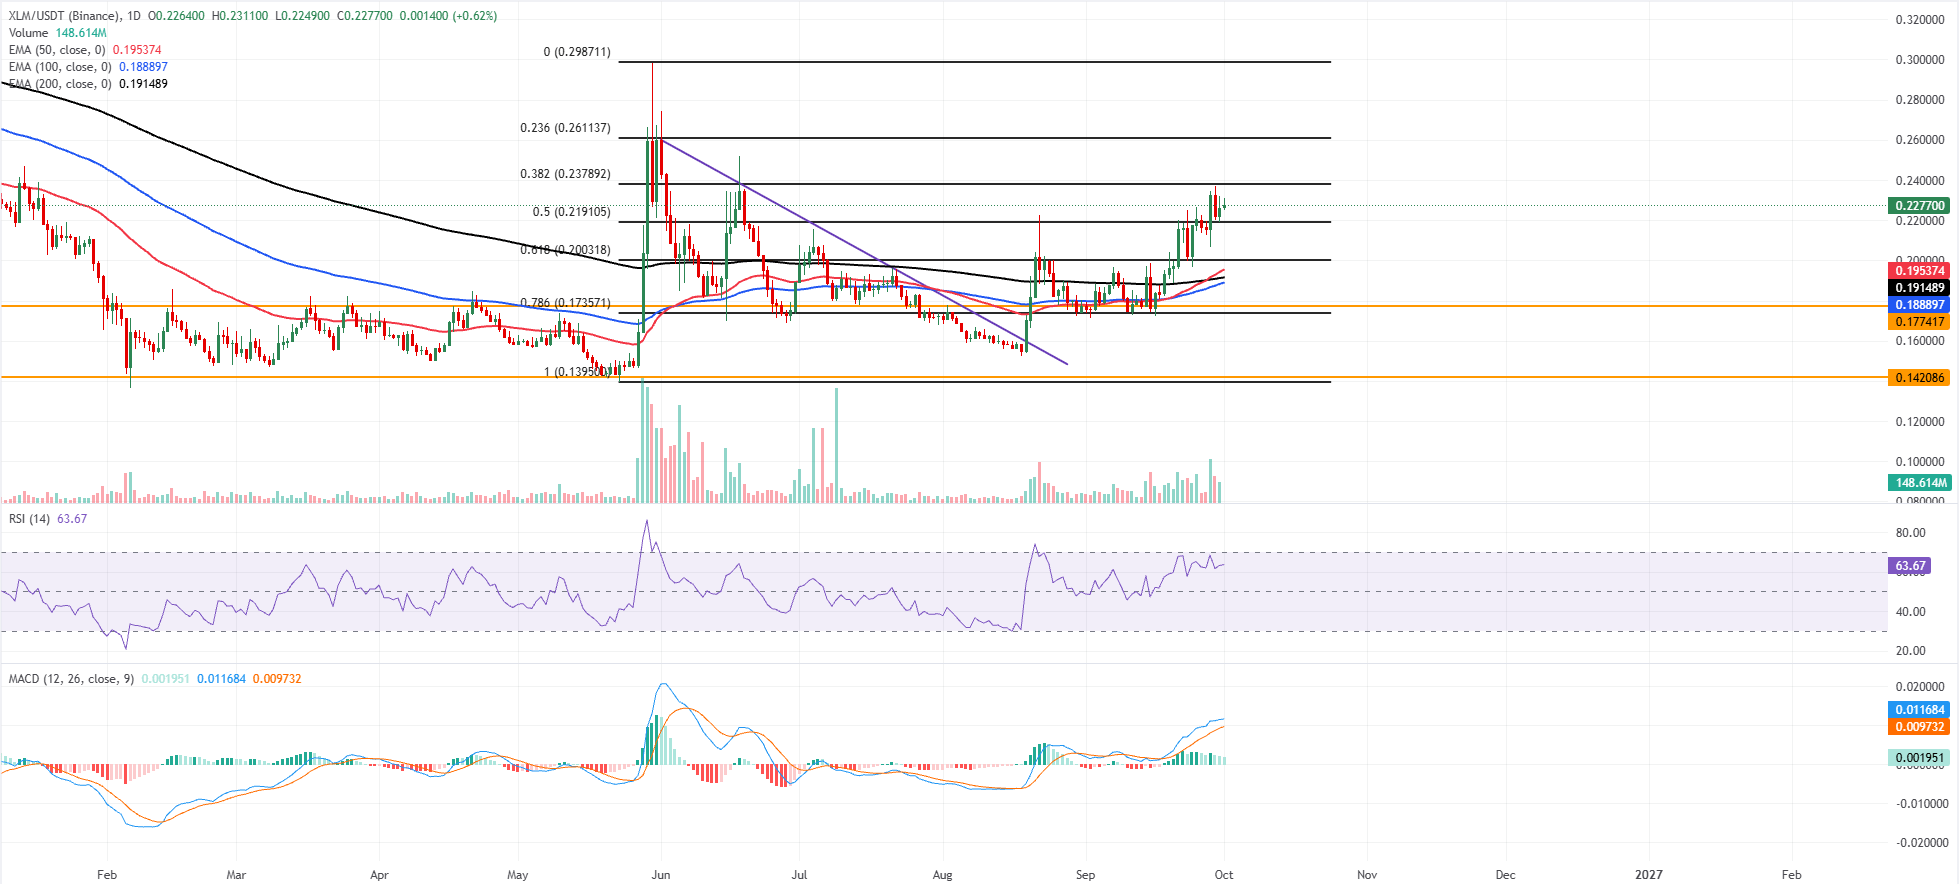
XLM/USDT daily chart

(The technical analysis of this story was written with the help of an AI tool. Know more.)

Disclaimer: For information purposes only. Past performance is not indicative of future results.
placeholder
October hike odds climb toward 60% as Goldman and BofA both flip — what Warsh's "dose of accommodation" really changedRate futures now price roughly 55% to 62% for a 25bp hike at the October 27-28 FOMC, up from about 30% before Chair Warsh's post-meeting framing that the Fed is merely "removing some accommodation." Goldman Sachs has added an October hike to its forecast and Bank of America now sees moves in both October and December. Here is the repricing, the language behind it, and the two data points that decide it.
Author  Irene Q.
Sep 23, Wed
Rate futures now price roughly 55% to 62% for a 25bp hike at the October 27-28 FOMC, up from about 30% before Chair Warsh's post-meeting framing that the Fed is merely "removing some accommodation." Goldman Sachs has added an October hike to its forecast and Bank of America now sees moves in both October and December. Here is the repricing, the language behind it, and the two data points that decide it.
placeholder
Four jobs reports in five days: what JOLTS, ADP, claims and the September payrolls mean for the October Fed decisionThe US labour market faces its densest data week of the month. JOLTS job openings land Tuesday (7.2 million expected), ADP on Wednesday (70,000 expected), initial claims on Thursday and the September non-farm payrolls on Friday (100,000 expected, down from 162,000). Markets price a 64%-70% chance of another quarter-point Fed hike on October 28. The dollar index sits at 100.77 and the S&P 500 at 7,729.8.
Author  Mitrade
Sep 28, Mon
The US labour market faces its densest data week of the month. JOLTS job openings land Tuesday (7.2 million expected), ADP on Wednesday (70,000 expected), initial claims on Thursday and the September non-farm payrolls on Friday (100,000 expected, down from 162,000). Markets price a 64%-70% chance of another quarter-point Fed hike on October 28. The dollar index sits at 100.77 and the S&P 500 at 7,729.8.
placeholder
Nvidia's $150 billion buyback landed — and the AI sector fell anyway. That's the signal worth tradingNvidia closed up 1.68% at $228.86 on 28 September after announcing a $150 billion share repurchase authorisation, the largest single corporate buyback on record, while the rest of the AI complex sold off: AMD -3.6%, Micron -2.6%, Meta -4.8% and the Philadelphia Semiconductor Index -1.61%. The divergence is not noise. Capital is rotating toward cash-flow certainty, not abandoning the AI theme. With Micron reporting after the close on 30 September, here is what the split means.
Author  Irene Q.
Sep 29, Tue
Nvidia closed up 1.68% at $228.86 on 28 September after announcing a $150 billion share repurchase authorisation, the largest single corporate buyback on record, while the rest of the AI complex sold off: AMD -3.6%, Micron -2.6%, Meta -4.8% and the Philadelphia Semiconductor Index -1.61%. The divergence is not noise. Capital is rotating toward cash-flow certainty, not abandoning the AI theme. With Micron reporting after the close on 30 September, here is what the split means.
placeholder
【Daily Brief】30-year Treasury tops 5.59%, S&P 500 slips to 7,670 and gold holds $4,180 — PCE lands tonightThe 30-year Treasury yield closed at 5.59%, its highest since June 2002, and the Dow fell 131.59 points to 51,349.92. US consumer confidence dropped to 81.9, a 12-year low, and JOLTS job openings fell to 7.1 million. August PCE and Q3 GDP both land at 8:30am ET tonight.
Author  Suzie
23 hours ago
The 30-year Treasury yield closed at 5.59%, its highest since June 2002, and the Dow fell 131.59 points to 51,349.92. US consumer confidence dropped to 81.9, a 12-year low, and JOLTS job openings fell to 7.1 million. August PCE and Q3 GDP both land at 8:30am ET tonight.
placeholder
Gold falls to near $4,150 as higher Treasury yields, oil prices outweigh softer PCE inflationGold price (XAU/USD) tumbles to near $4,150 during the early Asian session on Thursday, pressured by elevated US Treasury bond yields. Traders await the US September employment data for fresh impetus, which will be released later on Friday. 
Author  FXStreet
5 hours ago
Gold price (XAU/USD) tumbles to near $4,150 during the early Asian session on Thursday, pressured by elevated US Treasury bond yields. Traders await the US September employment data for fresh impetus, which will be released later on Friday. 
Related Instrument
goTop
quote