


United States Dollar Index approaches yearly high near 101.80, US ISM PMI in focus
- The US Dollar Index approaches the all-time high of 101.80 on the back of hawkish Fed speak.
- Fed’s Kashkari guides for one more hike this year and another in 2027.
- Investors await the US ISM Manufacturing PMI and the NFP data for September.
The US Dollar (USD) outperforms its major currency peers on Thursday. In the Asian session, the US Dollar Index (DXY), which gauges the Greenback’s value against six major currencies, trades 0.13% higher to near 101.60. The DXY is little far from its yearly high of 101.80.
US Dollar Price Today
The table below shows the percentage change of US Dollar (USD) against listed major currencies today. US Dollar was the strongest against the Japanese Yen.
| USD | EUR | GBP | JPY | CAD | AUD | NZD | CHF | |
|---|---|---|---|---|---|---|---|---|
| USD | 0.05% | 0.09% | 0.47% | 0.10% | -0.01% | 0.18% | 0.07% | |
| EUR | -0.05% | 0.04% | 0.39% | 0.03% | -0.08% | 0.11% | 0.00% | |
| GBP | -0.09% | -0.04% | 0.36% | 0.00% | -0.11% | 0.09% | -0.02% | |
| JPY | -0.47% | -0.39% | -0.36% | -0.38% | -0.48% | -0.30% | -0.40% | |
| CAD | -0.10% | -0.03% | 0.00% | 0.38% | -0.10% | 0.08% | -0.02% | |
| AUD | 0.01% | 0.08% | 0.11% | 0.48% | 0.10% | 0.21% | 0.11% | |
| NZD | -0.18% | -0.11% | -0.09% | 0.30% | -0.08% | -0.21% | -0.08% | |
| CHF | -0.07% | -0.01% | 0.02% | 0.40% | 0.02% | -0.11% | 0.08% |
The heat map shows percentage changes of major currencies against each other. The base currency is picked from the left column, while the quote currency is picked from the top row. For example, if you pick the US Dollar from the left column and move along the horizontal line to the Japanese Yen, the percentage change displayed in the box will represent USD (base)/JPY (quote).
What drives US Dollar higher?
It appears that the hawkish commentary from Minneapolis Federal Reserve (Fed) Bank President Neel Kashkari at a Q&A at the Council on Foreign Relations in Wednesday has lifted the US Dollar, which corrected sharply in the early trade the same day.
Fed’s Kashkari delivered a notably hawkish-leaning message, with the FXS Speechtracker score at 7.1 versus a 6.2 historical average, underscoring concern that inflation near 3% remains too high and that resilient growth may signal policy is less tight than assumed. The emphasis on a potentially higher and elevated neutral rate, combined with guidance for one more hike this year and another in 2027, reinforces a narrative of prolonged restrictive policy that is broadly supportive for the Dollar even as Kashkari still hopes to tame inflation with only modest action.
The FXS Fed Sentiment Index slipped by 0.42 points to 143.28, indicating a slight moderation in perceived hawkishness despite the strong tone of the speech. With the index firmly above the 100 neutral line, the Fed remains in clearly hawkish territory, and the small pullback suggests markets are adjusting expectations at the margin rather than fundamentally reassessing the policy stance highlighted by the FXS Speechtracker.
What’s next for US Dollar?
Later in the day, investors will pay close attention to the United States (US) ISM Manufacturing Purchasing Managers’ Index (PMI) data for September, which will be published at 14:00 GMT. The Manufacturing PMI is seen higher at 55.0 from 54.6 in August.
The preliminary S&P Global PMI data for September remained stronger-than-projected, which underscored robust US private sector activity and lifted hawkish Fed expectations.
In the remaining week, the US Nonfarm Payrolls (NFP) data for September will be the key trigger for the US Dollar, which will be released on Friday. Ahead of the US NFP data, ADP Employment Change data for September has set a positive tone. On Wednesday, the ADP reported that the private sector created 90K fresh jobs, higher than 70K estimates and the August reading of 36K.
US Dollar Index Technical Analysis
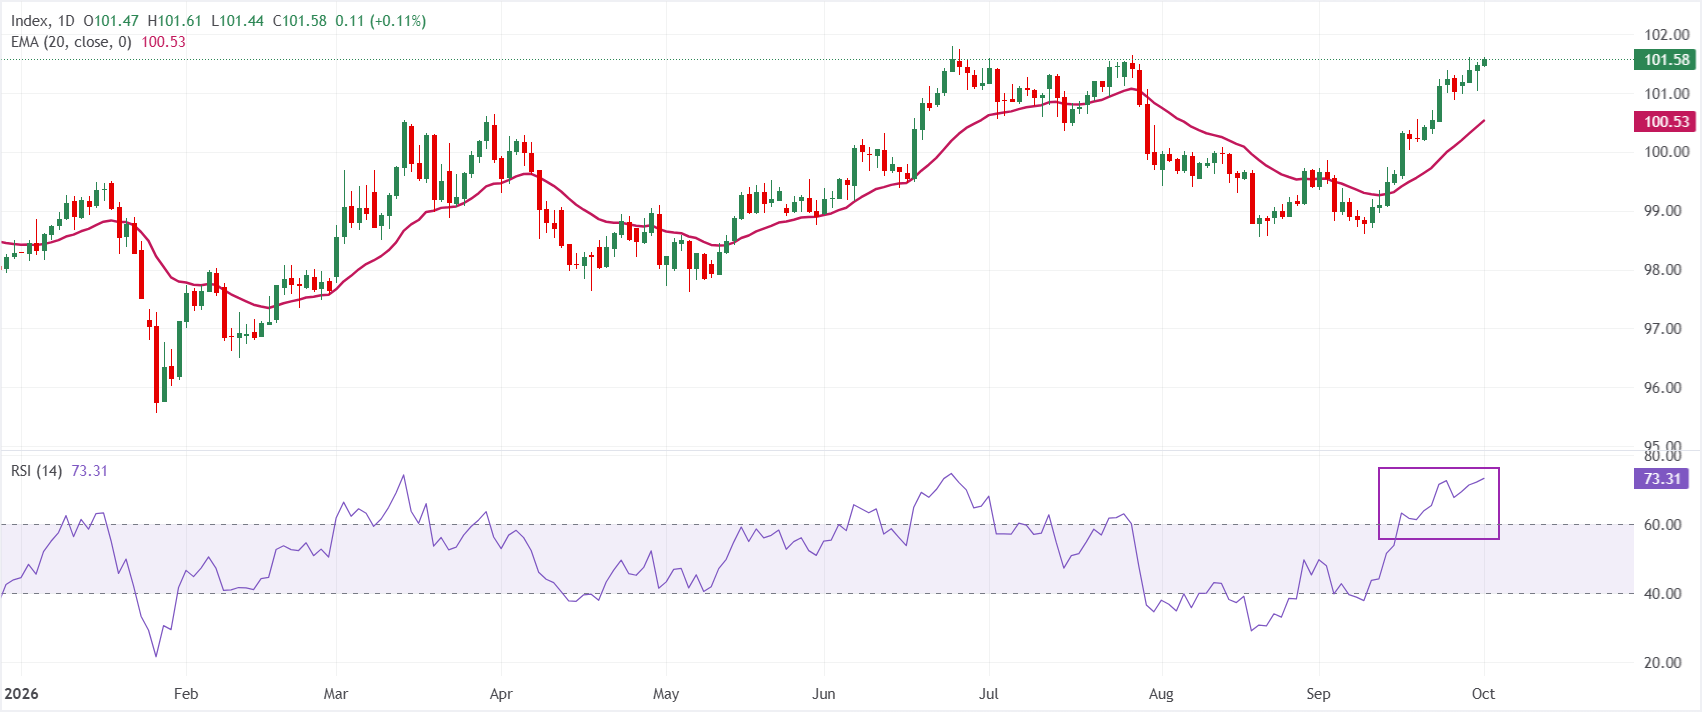
In the daily chart, Dollar Index Spot trades at 101.58. The near-term bias is bullish as price holds above the 20-day Exponential Moving Average (EMA) at 100.53, reinforcing an upside-oriented structure after reclaiming the 101 handle. The 14-day Relative Strength Index (RSI) at 73.32 shows overbought conditions, hinting that the latest advance is stretched but not yet signaling a clear reversal.
On the downside, immediate support is seen at the 20-day EMA near 100.53, which protects the recent breakout zone and would need to give way to weaken the constructive tone. With no clear resistance levels in the provided dataset, any pullback towards the 101.00–100.50 region is likely to be watched as a test of underlying demand rather than a confirmed topping signal.
(The technical analysis of this story was written with the help of an AI tool. Know more.)
Economic Indicator
ADP Employment Change
The ADP Employment Change is a gauge of employment in the private sector released by the largest payroll processor in the US, Automatic Data Processing Inc. It measures the change in the number of people privately employed in the US. Generally speaking, a rise in the indicator has positive implications for consumer spending and is stimulative of economic growth. So a high reading is traditionally seen as bullish for the US Dollar (USD), while a low reading is seen as bearish.
Read more.Last release: Wed Sep 30, 2026 12:15
Frequency: Monthly
Actual: 90K
Consensus: 70K
Previous: 38K
Source: ADP Research Institute
Traders often consider employment figures from ADP, America’s largest payrolls provider, report as the harbinger of the Bureau of Labor Statistics release on Nonfarm Payrolls (usually published two days later), because of the correlation between the two. The overlaying of both series is quite high, but on individual months, the discrepancy can be substantial. Another reason FX traders follow this report is the same as with the NFP – a persistent vigorous growth in employment figures increases inflationary pressures, and with it, the likelihood that the Fed will raise interest rates. Actual figures beating consensus tend to be USD bullish.
Recommended Articles


