


Crypto Today: Bitcoin, Ethereum, XRP correct upward amid declining ETF inflows
- Bitcoin ticks up near $84,000 as bulls push to regain trend control following mild inflows into spot ETFs.
- Ethereum consolidates above $2,700 amid a broader bullish technical outlook and weakening institutional demand.
- XRP rises and reclaims $1.50 as momentum gradually builds on a solid moving-average support cluster.
The cryptocurrency market upholds a neutral-to-bullish bias on Tuesday, with Bitcoin (BTC) edging closer to a breakout above $84,000. Altcoins mirror BTC’s outlook, with Ethereum (ETH) holding above $2,700 and Ripple (XRP) pushing past the reclaimed $1.50 level.
Meanwhile, the path of least resistance appears to be upward despite shrinking institutional interest. On the bright side, firm technical structures suggest bulls have the upper hand.
ETF uptake dips as BTC, ETH and XRP consolidate
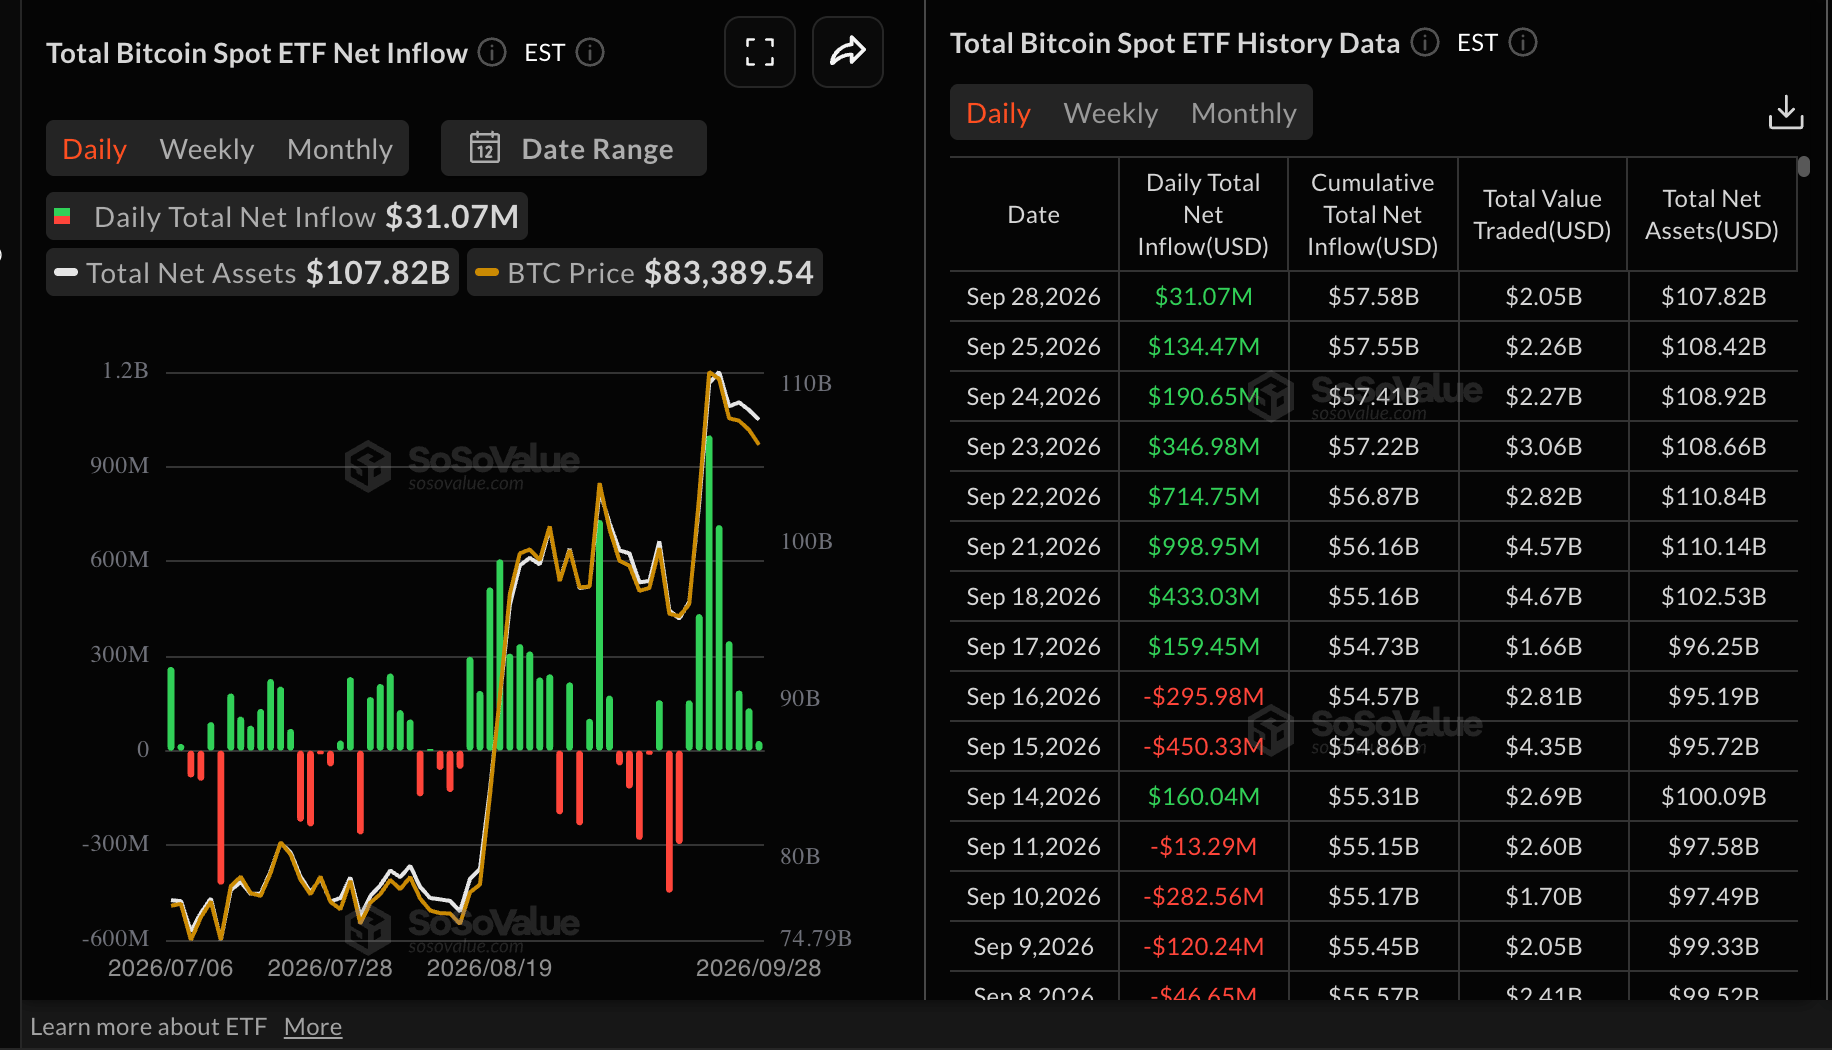
Bitcoin spot Exchange-Traded Funds (ETFs) extended their bullish streak with $31 million inflows on Monday, a notable drop from the $134 million last Friday. Last week alone, US-listed ETFs drew $2.4 billion in inflows, underscoring growing institutional demand. With the uptake falling this week, the tailwind that ETFs provided may shrink, leading to consolidation at key support ranges.
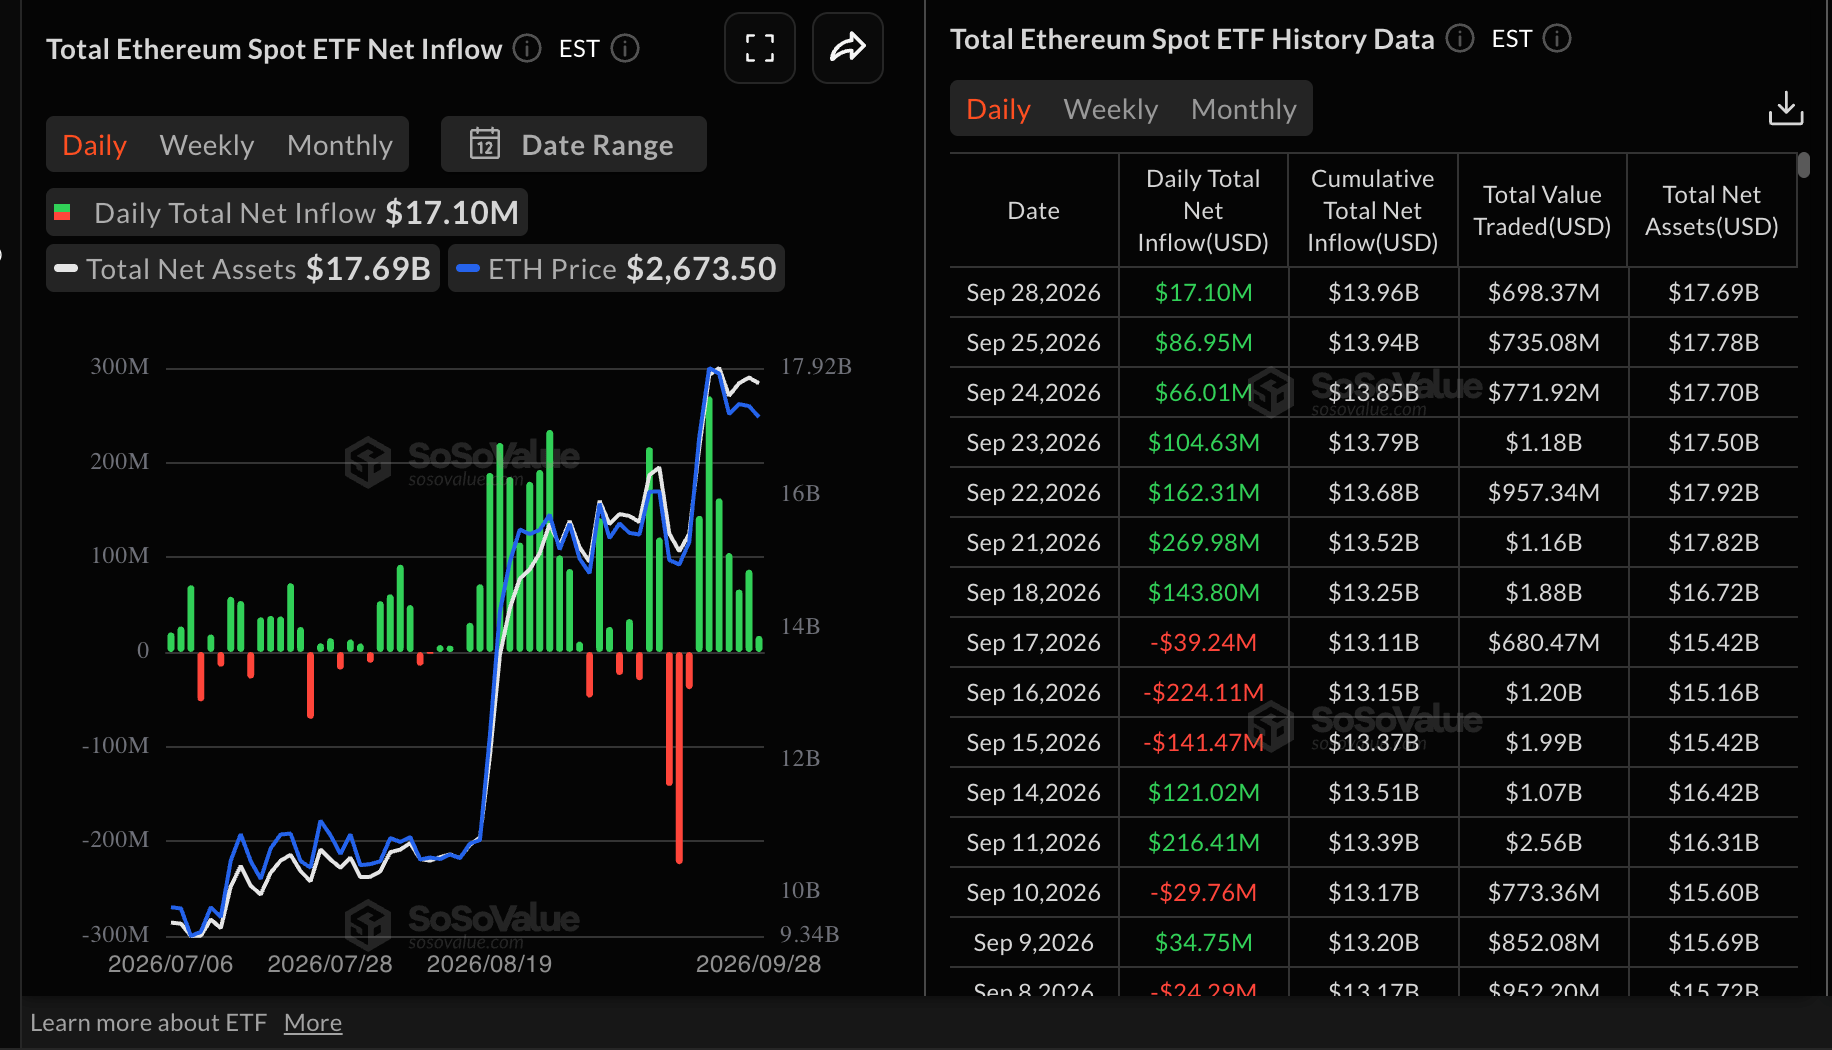
Ethereum spot ETFs similarly saw inflows drop to $17 million on Monday, from $87 million last Friday. Cumulative inflows currently stand near $14 billion while net assets under management are edging closer to $18 billion. Positive flows underpin the broader institutional outlook in the largest smart contract token.
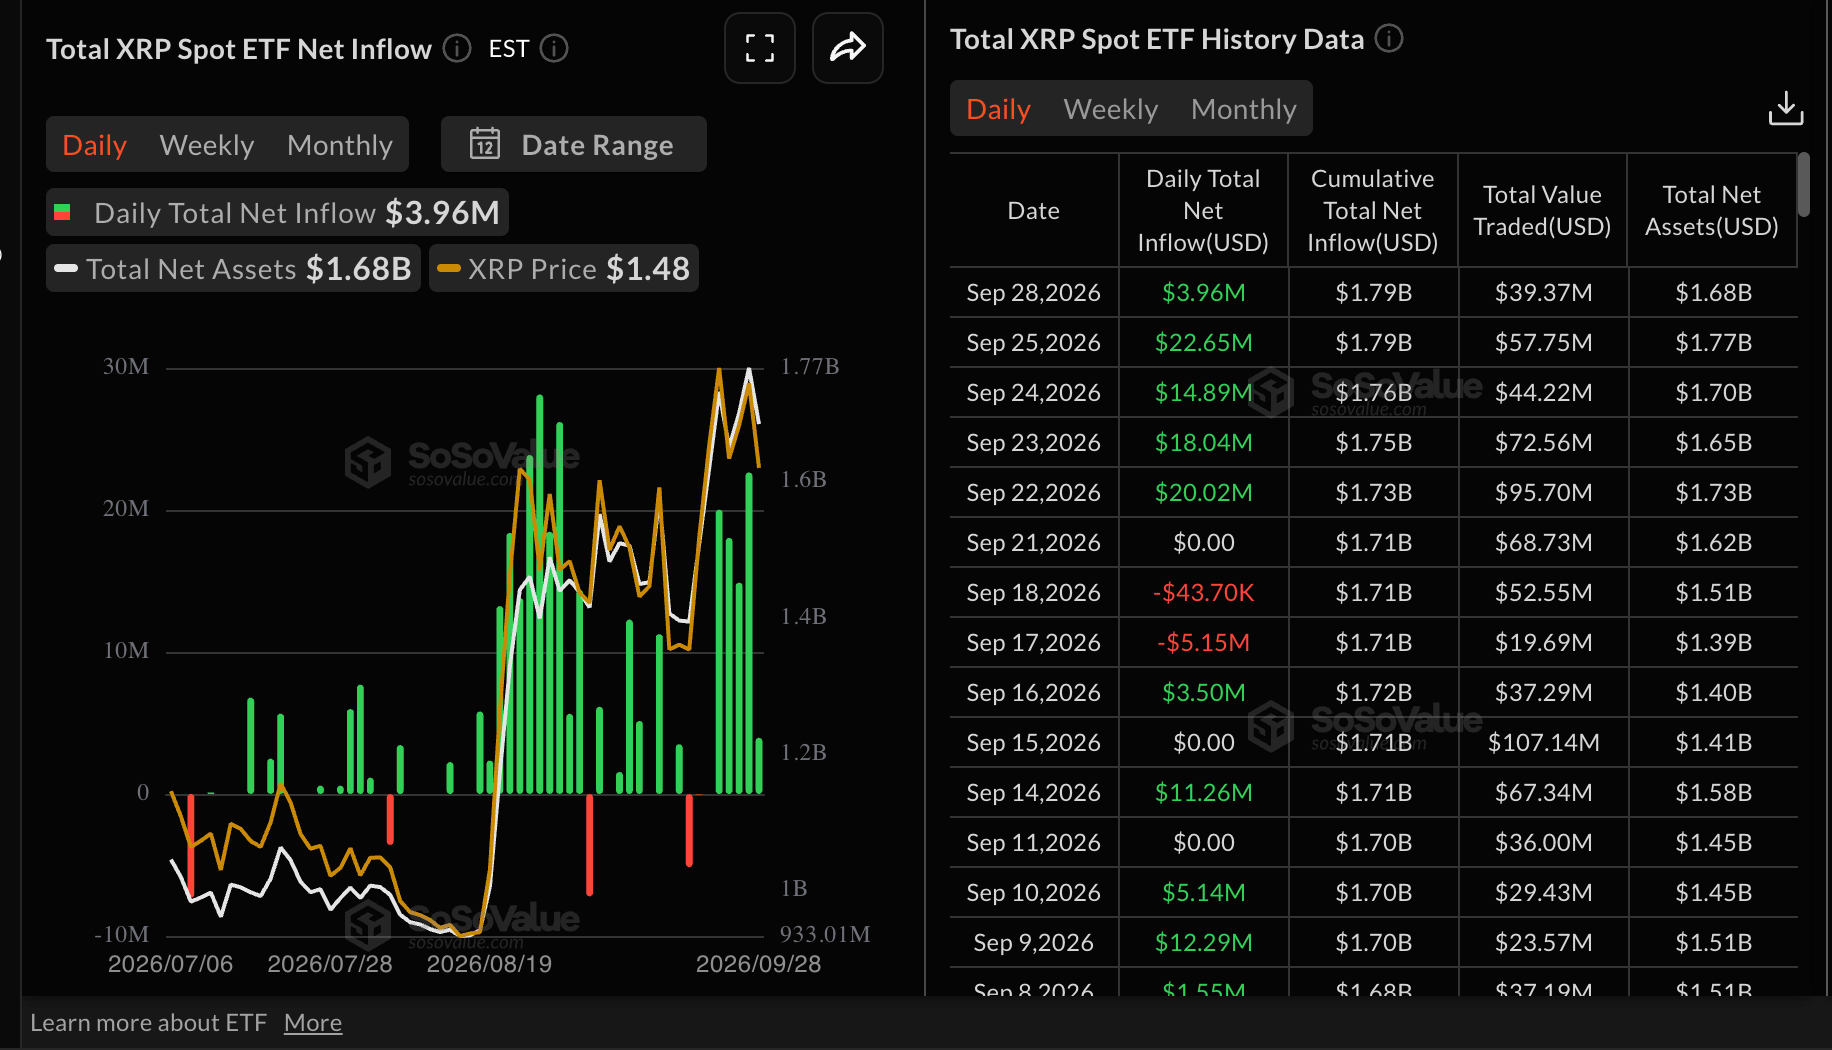
US-listed spot ETFs also recorded a significant drop in inflows to $4 million on Monday after posting approximately $23 million last Friday. This marked the fifth consecutive day of inflows, indicating steady but declining support from institutional traders. Cumulative inflows are near $1.8 billion while net assets average $1.7 billion, according to SoSoValue.
Technical Analysis: Bitcoin bulls eye short-term breakout
Bitcoin trades upward near $84,000, marking a mild recovery from Monday lows of $82,544. The largest crypto by market capitalization extends a bullish near‑term bias as price holds well above the key Exponential Moving Averages (EMAs).
The 50‑day EMA around $77,582, the 100‑day EMA near $74,129 and the 200‑day EMA at $74,361 all sit comfortably below spot, suggesting a firmly supported underlying trend, while the SuperTrend line at $78,351 also reinforces the constructive structure.
Momentum is mixed, with the Relative Strength Index (RSI) at 62 hinting at positive but not extreme buying pressure, even as the Moving Average Convergence Divergence (MACD) indicator has slipped marginally below the zero line, suggesting a waning drive rather than a decisive shift.
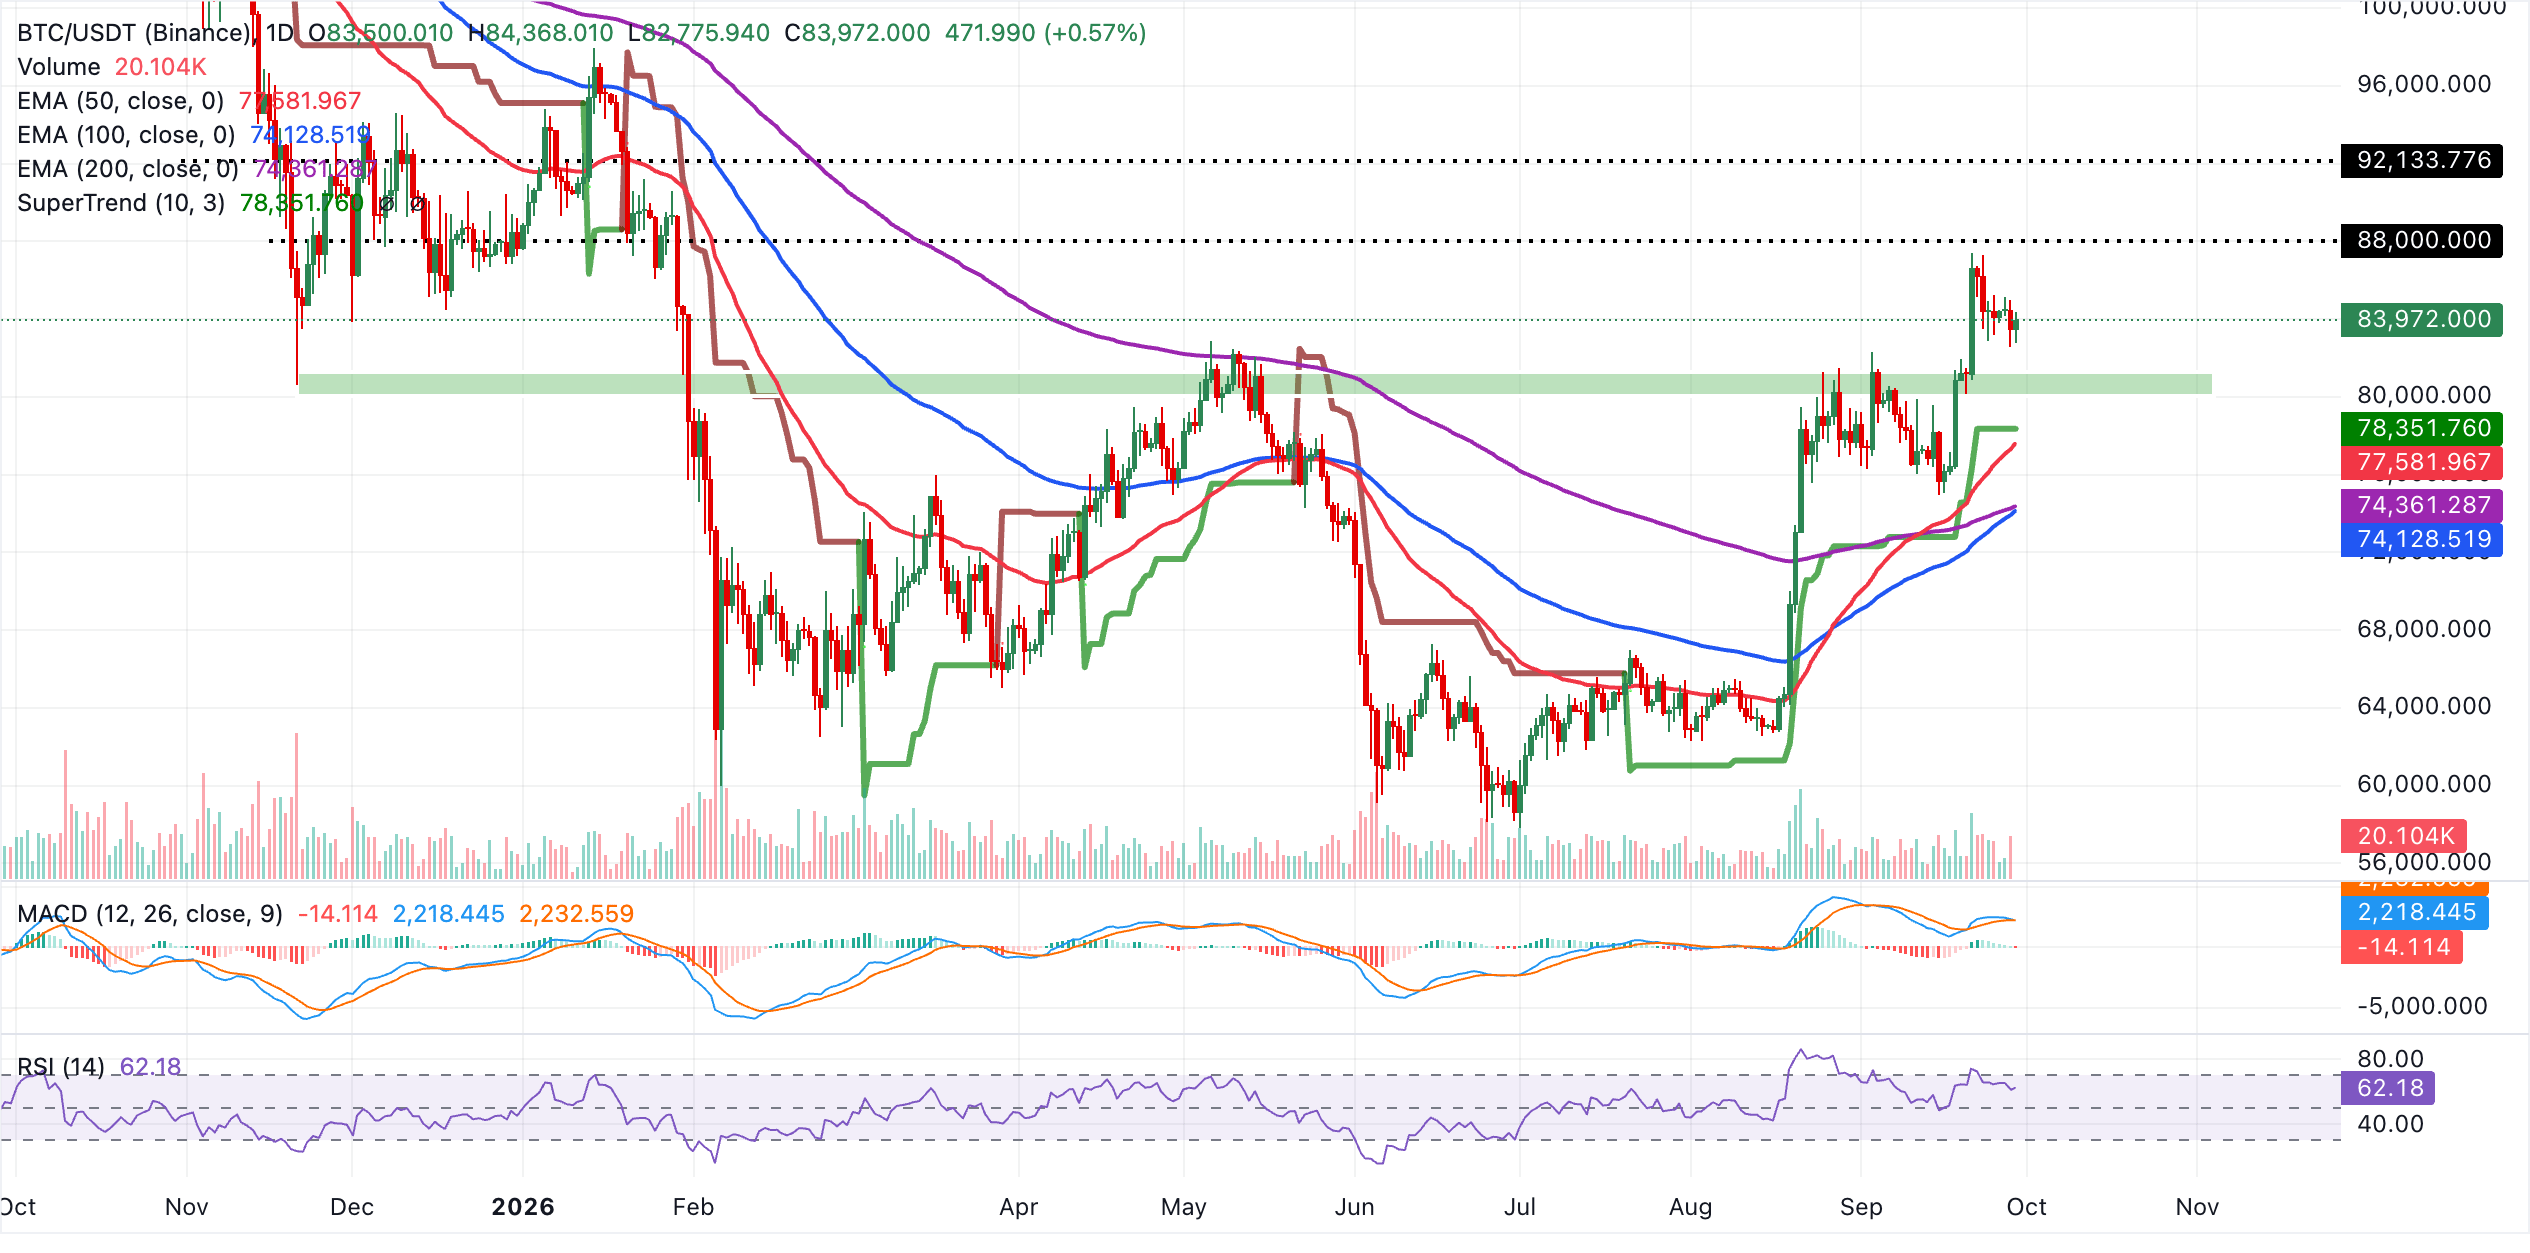
On the downside, initial support emerges at the SuperTrend level around $78,351, followed by the 50‑day EMA at $77,582, which should act as a secondary floor on deeper pullbacks. Below that, a wider structural demand zone is defined by the 200‑day EMA at $74,361 and the 100‑day EMA at $74,129, where buyers would likely attempt to defend the broader uptrend if a more pronounced correction unfolds.
With no clearly defined resistance levels on the daily chart, the pair’s topside remains open, and the focus stays on how long bulls can preserve the current cushion above these clustered supports.
Altcoins technical analysis: Ethereum and XRP edge higher as bulls return
Ethereum trades near $2,720, retaining a bullish near‑term bias as price holds well above the main moving averages. The cluster reinforces a broadly supportive backdrop after the recent advance, even as the MACD indicator has slipped below the zero line and hints at waning upside momentum.
Meanwhile, the RSI around 65 stays in bullish territory without yet entering overbought conditions, suggesting dips could still attract buyers while the current structure remains intact.
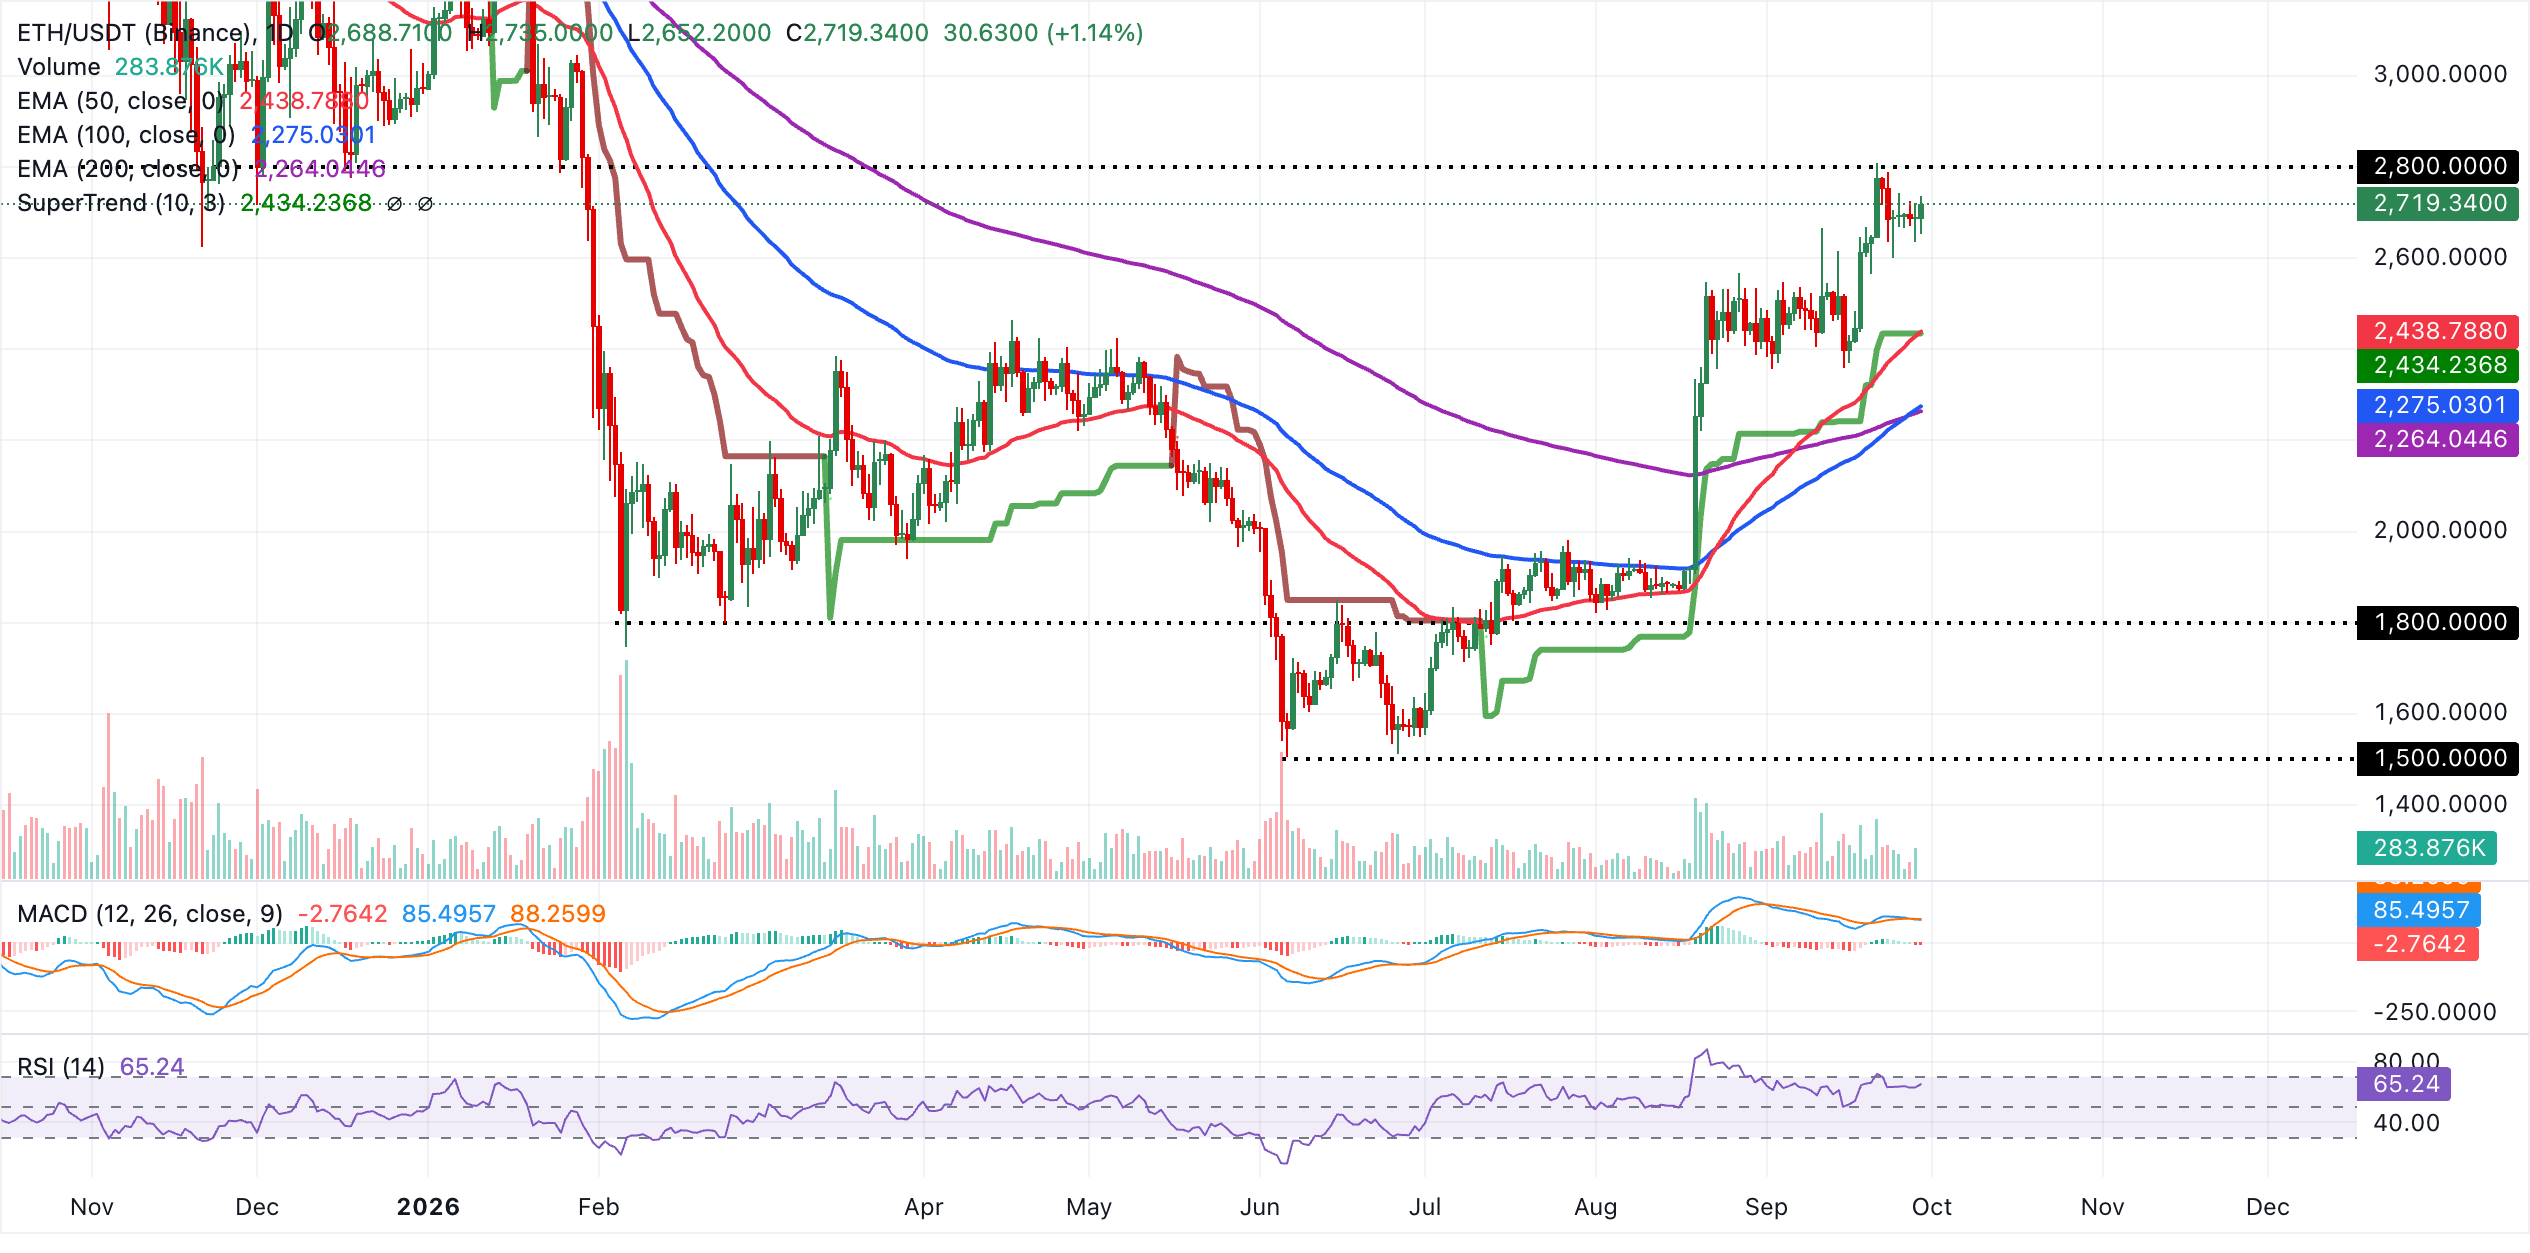
On the downside, initial support is seen at the clustered zone formed by the 50‑day EMA at $2,439 and the SuperTrend level at $2,434, where buyers are likely to defend the short‑term trend. Below that area, the 100‑day EMA at $2,275 and the 200‑day EMA at $2,264 line up as a deeper demand band that underpins the broader uptrend.
With no clear overhead technical barriers derived on the daily chart, the pair’s path of least resistance remains to the upside as long as it stays above these moving‑average supports.
XRP, similarly, ticks higher above $1.50, maintaining a bullish near-term bias as price holds well above the key moving averages, hinting at a supportive underlying trend and a constructive structure. Momentum metrics back this tone, with the RSI hovering near 57 and the MACD marginally above zero, suggesting buyers retain control even as the latest advance consolidates.
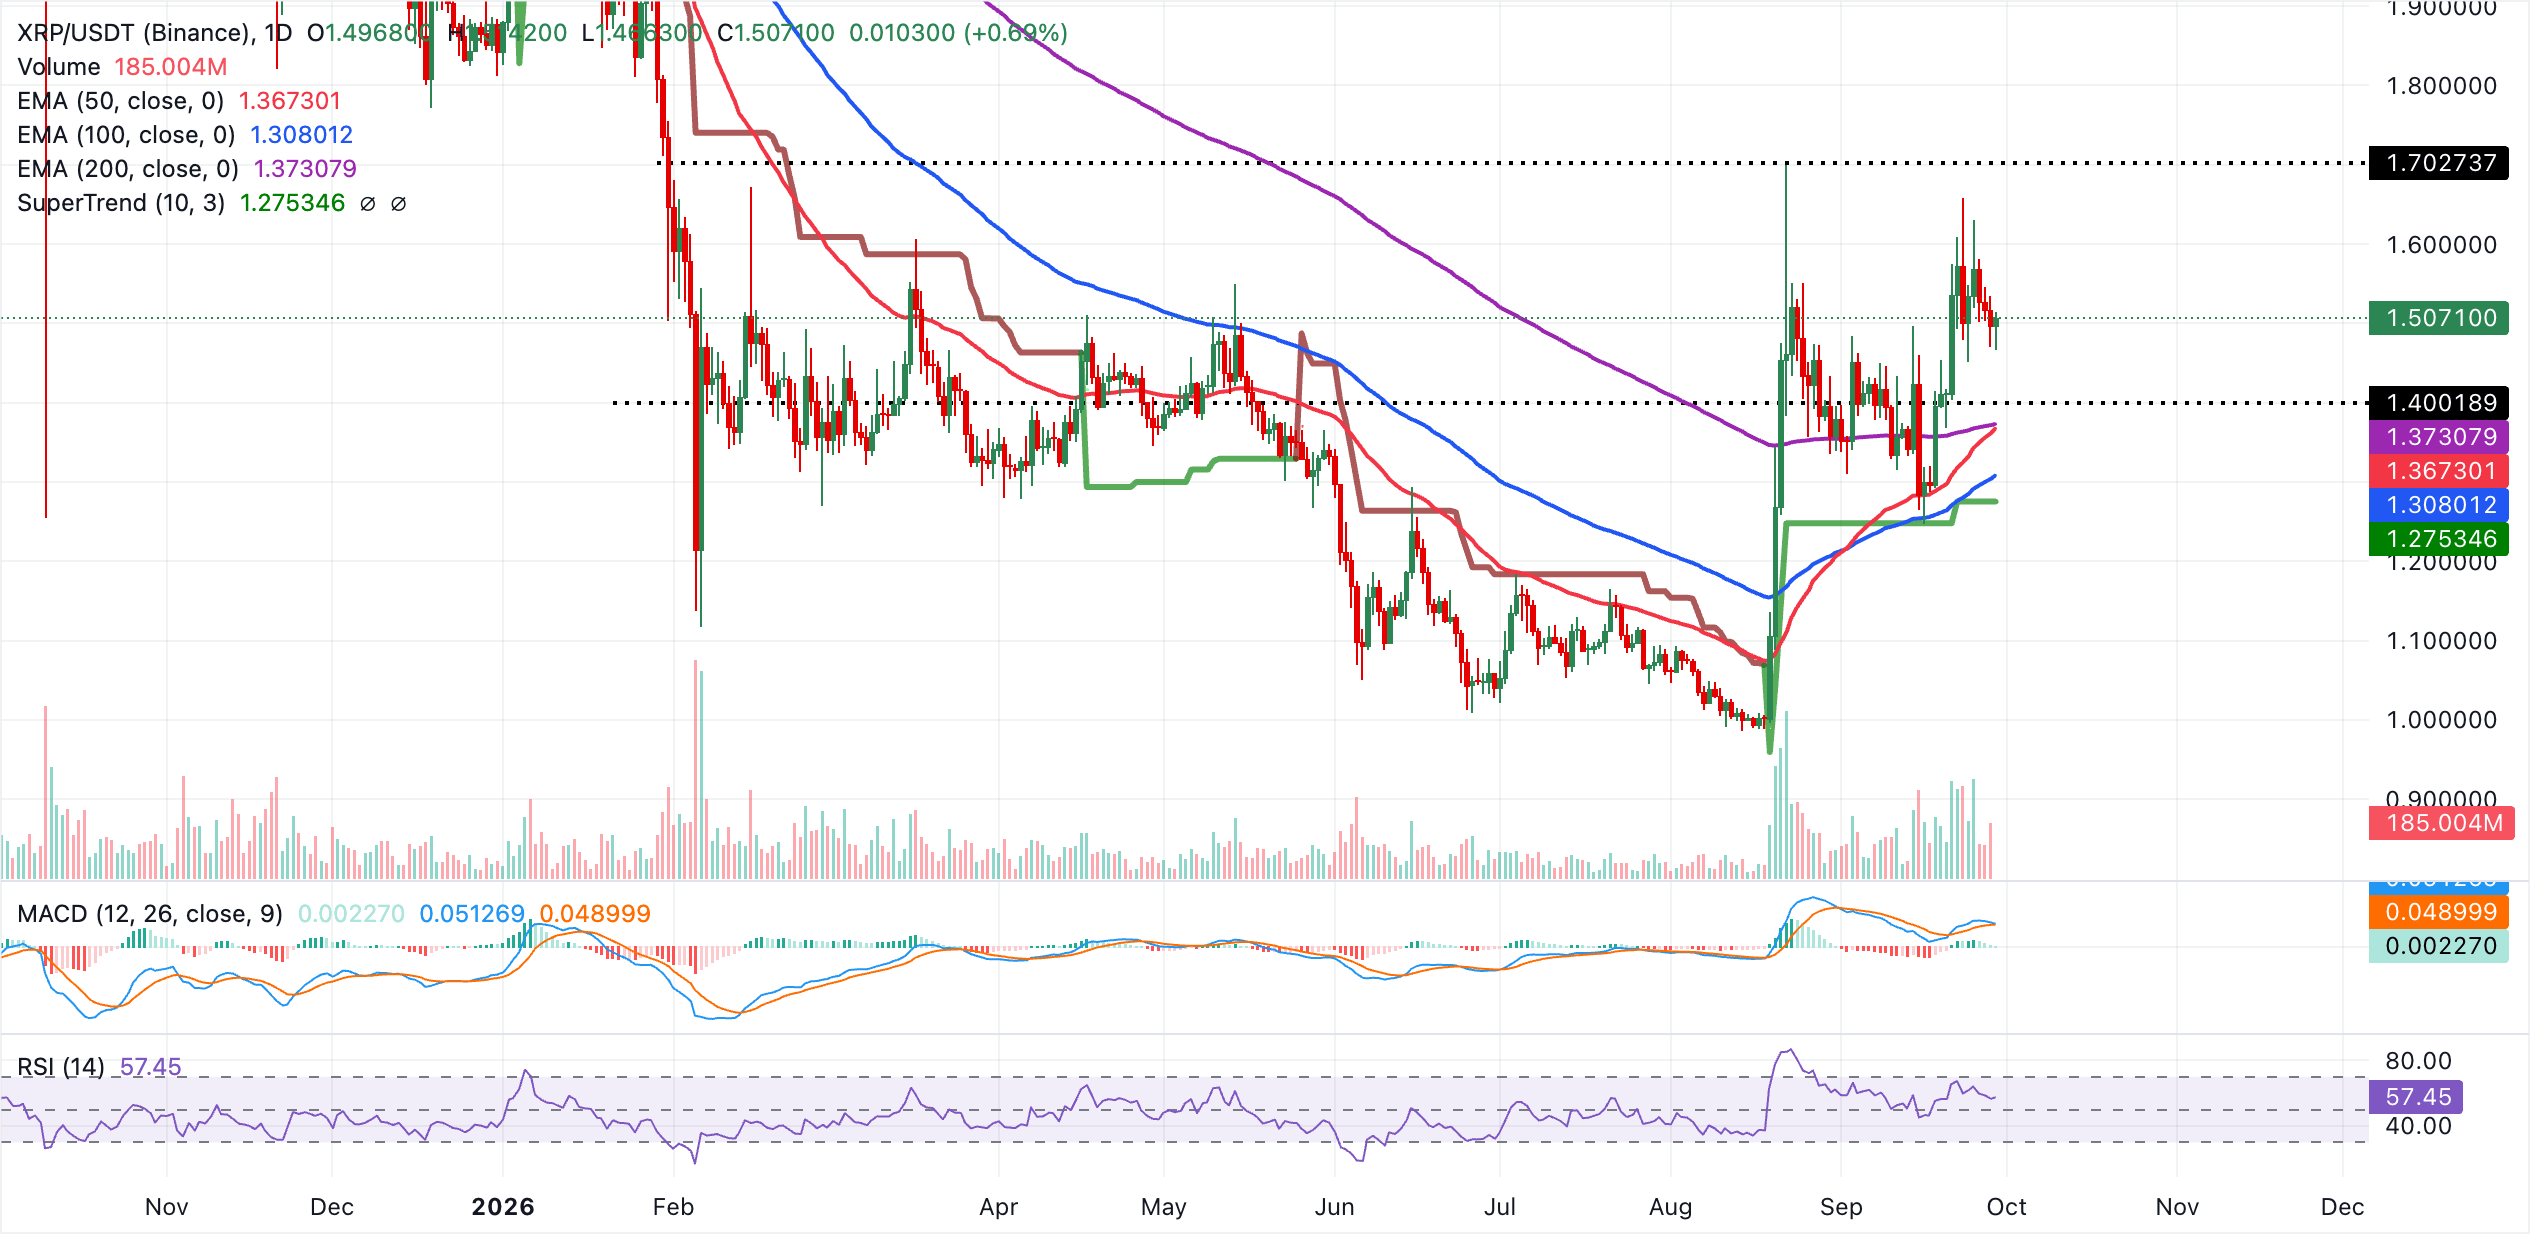
On the downside, immediate support is located at the recent close around 1.5071, ahead of a first structural demand zone defined by the clustered 50-day EMA at 1.3673 and 200-day EMA at 1.3731. A deeper pullback would expose the 100-day EMA at 1.3080, with the SuperTrend line at 1.2753 acting as a more distant, yet still relevant, bullish pivot. With no nearby overhead indicators from this dataset to cap price, the pair would likely continue to favor gradual upside as long as it stays above the EMA cluster, while a sustained move below those averages would be needed to weaken the current positive technical outlook.
(The technical analysis of this story was written with the help of an AI tool. Know more.)
Recommended Articles


