

Eye On $91,500: Key Bitcoin Level Could Trigger Massive Surge, Analyst Warns

Source Newsbtc

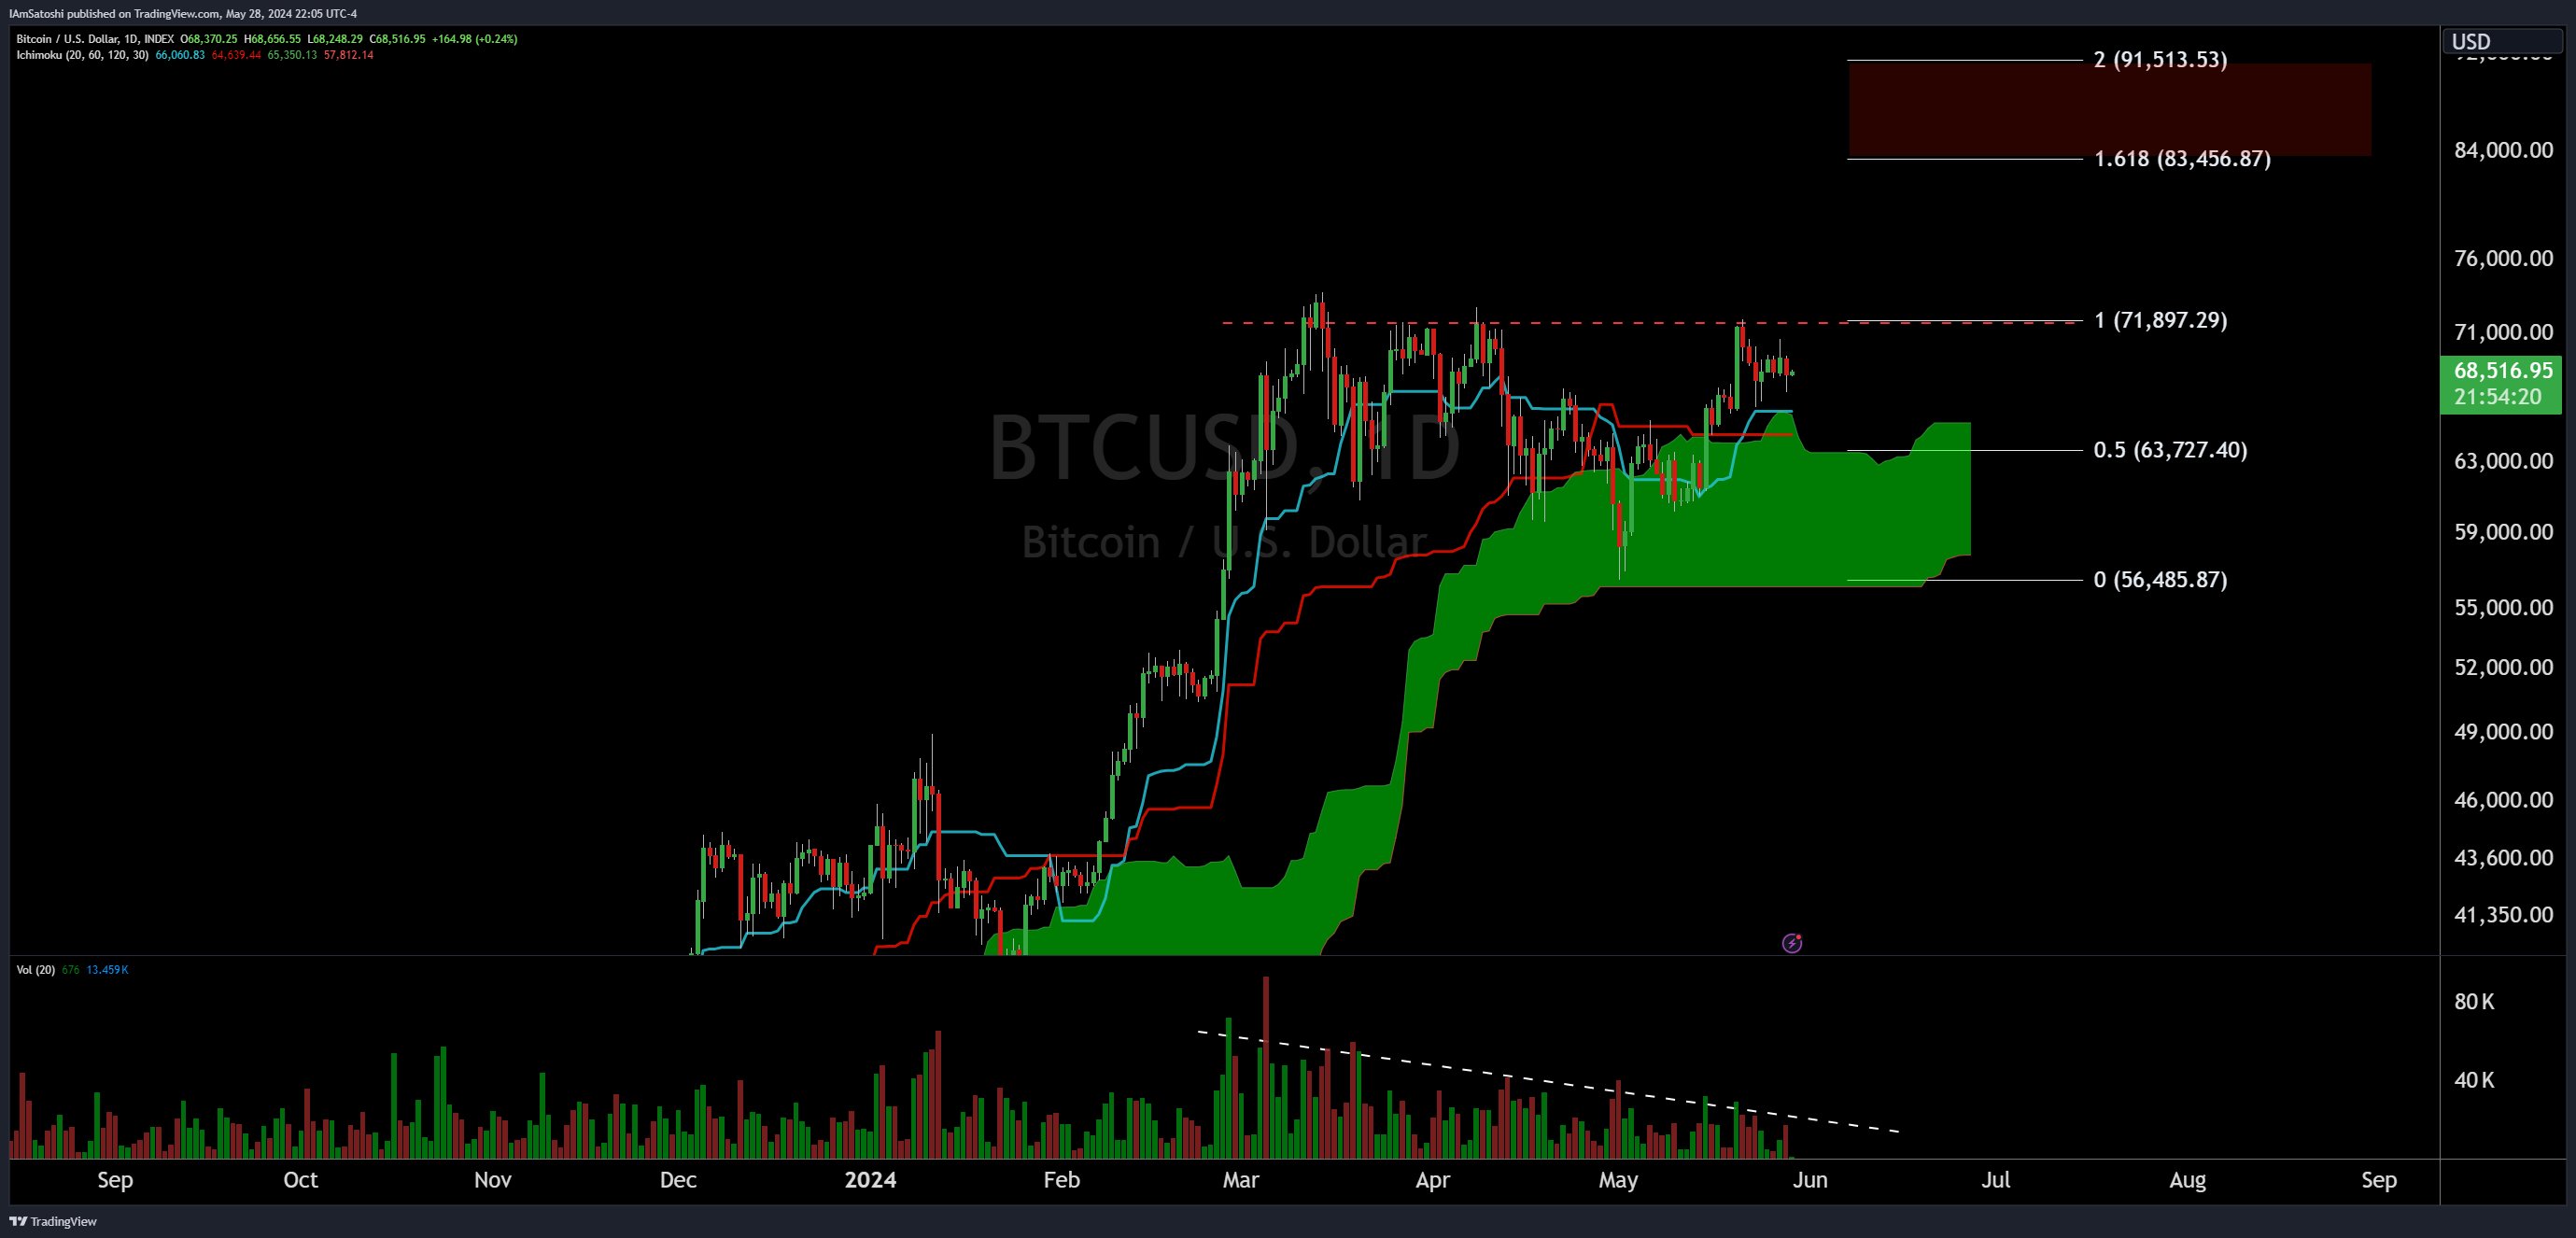
In a technical analysis shared by noted crypto analyst Josh Olszewicz on the social platform X, there appears to be a significant bullish sentiment building around Bitcoin, particularly if it surpasses the crucial $72,000 mark. Olszewicz, leveraging both the Ichimoku Cloud and Fibonacci extensions, illustrates a scenario where breaking this key resistance level could catapult Bitcoin towards a target of $91,500.

Here’s How Bitcoin Could Skyrocket To $91,500

The analysis utilizes the Ichimoku Cloud, a complex technical indicator that provides insights into the market’s momentum, trend direction, and potential areas of support and resistance over different time frames. Currently, Bitcoin’s price action is depicted as being in a bullish phase, situated above the cloud. This positioning above the cloud is traditionally viewed as a bullish signal, suggesting a strong uptrend with robust support levels formed by the cloud’s lower boundaries.
Bitcoin price analysis

In the Ichimoku setup, the conversion line (Tenkan-sen) and the baseline (Kijun-sen) cross occasionally, providing buy or sell signals based on their intersection relative to the cloud. As of the latest chart, the conversion line recently crossed above the baseline, reinforcing the bullish outlook depicted by the cloud’s positioning.

Adding another layer to the technical narrative, Fibonacci extension levels have been plotted from a significant low at $56,485.87 up to a high, providing potential targets and resistance levels. The 0.5 Fibonacci extension level is marked at $63,727.40, already surpassed by the current price trajectory.

The 1.0 extension finds itself at $71,897.29, closely aligning with the analyst’s noted pivotal level of $72,000. Beyond this, the 1.618 extension at $83,456.87 represents a lucrative first price target, while the ultimate 2.0 extension looms at $91,513.53.

A key observation is the volume profile, which shows a declining trend in trading volume. This decreasing volume can often indicate a period of accumulation, as less selling pressure allows prices to stabilize and potentially build a base for an upward breakout. The declining volume trend line underpins the consolidation phase seen in recent months, suggesting that a sharp movement could be imminent once accumulation concludes.

Olszewicz’s emphatic remark, “BTC: when this baby hits $72k you’re going to see some serious shit,” underscores the high stakes associated with this resistance level. This is not merely a technical observation but a signal to the market that once $72,000 is decisively broken, the path to much higher levels becomes increasingly probable.

Such a breakout would likely activate a flurry of trading activity, as both retail and institutional investors might see it as a confirmation of a sustained upward trend, potentially pushing the price towards the $91,500 mark indicated by the 2.0 Fibonacci extension.

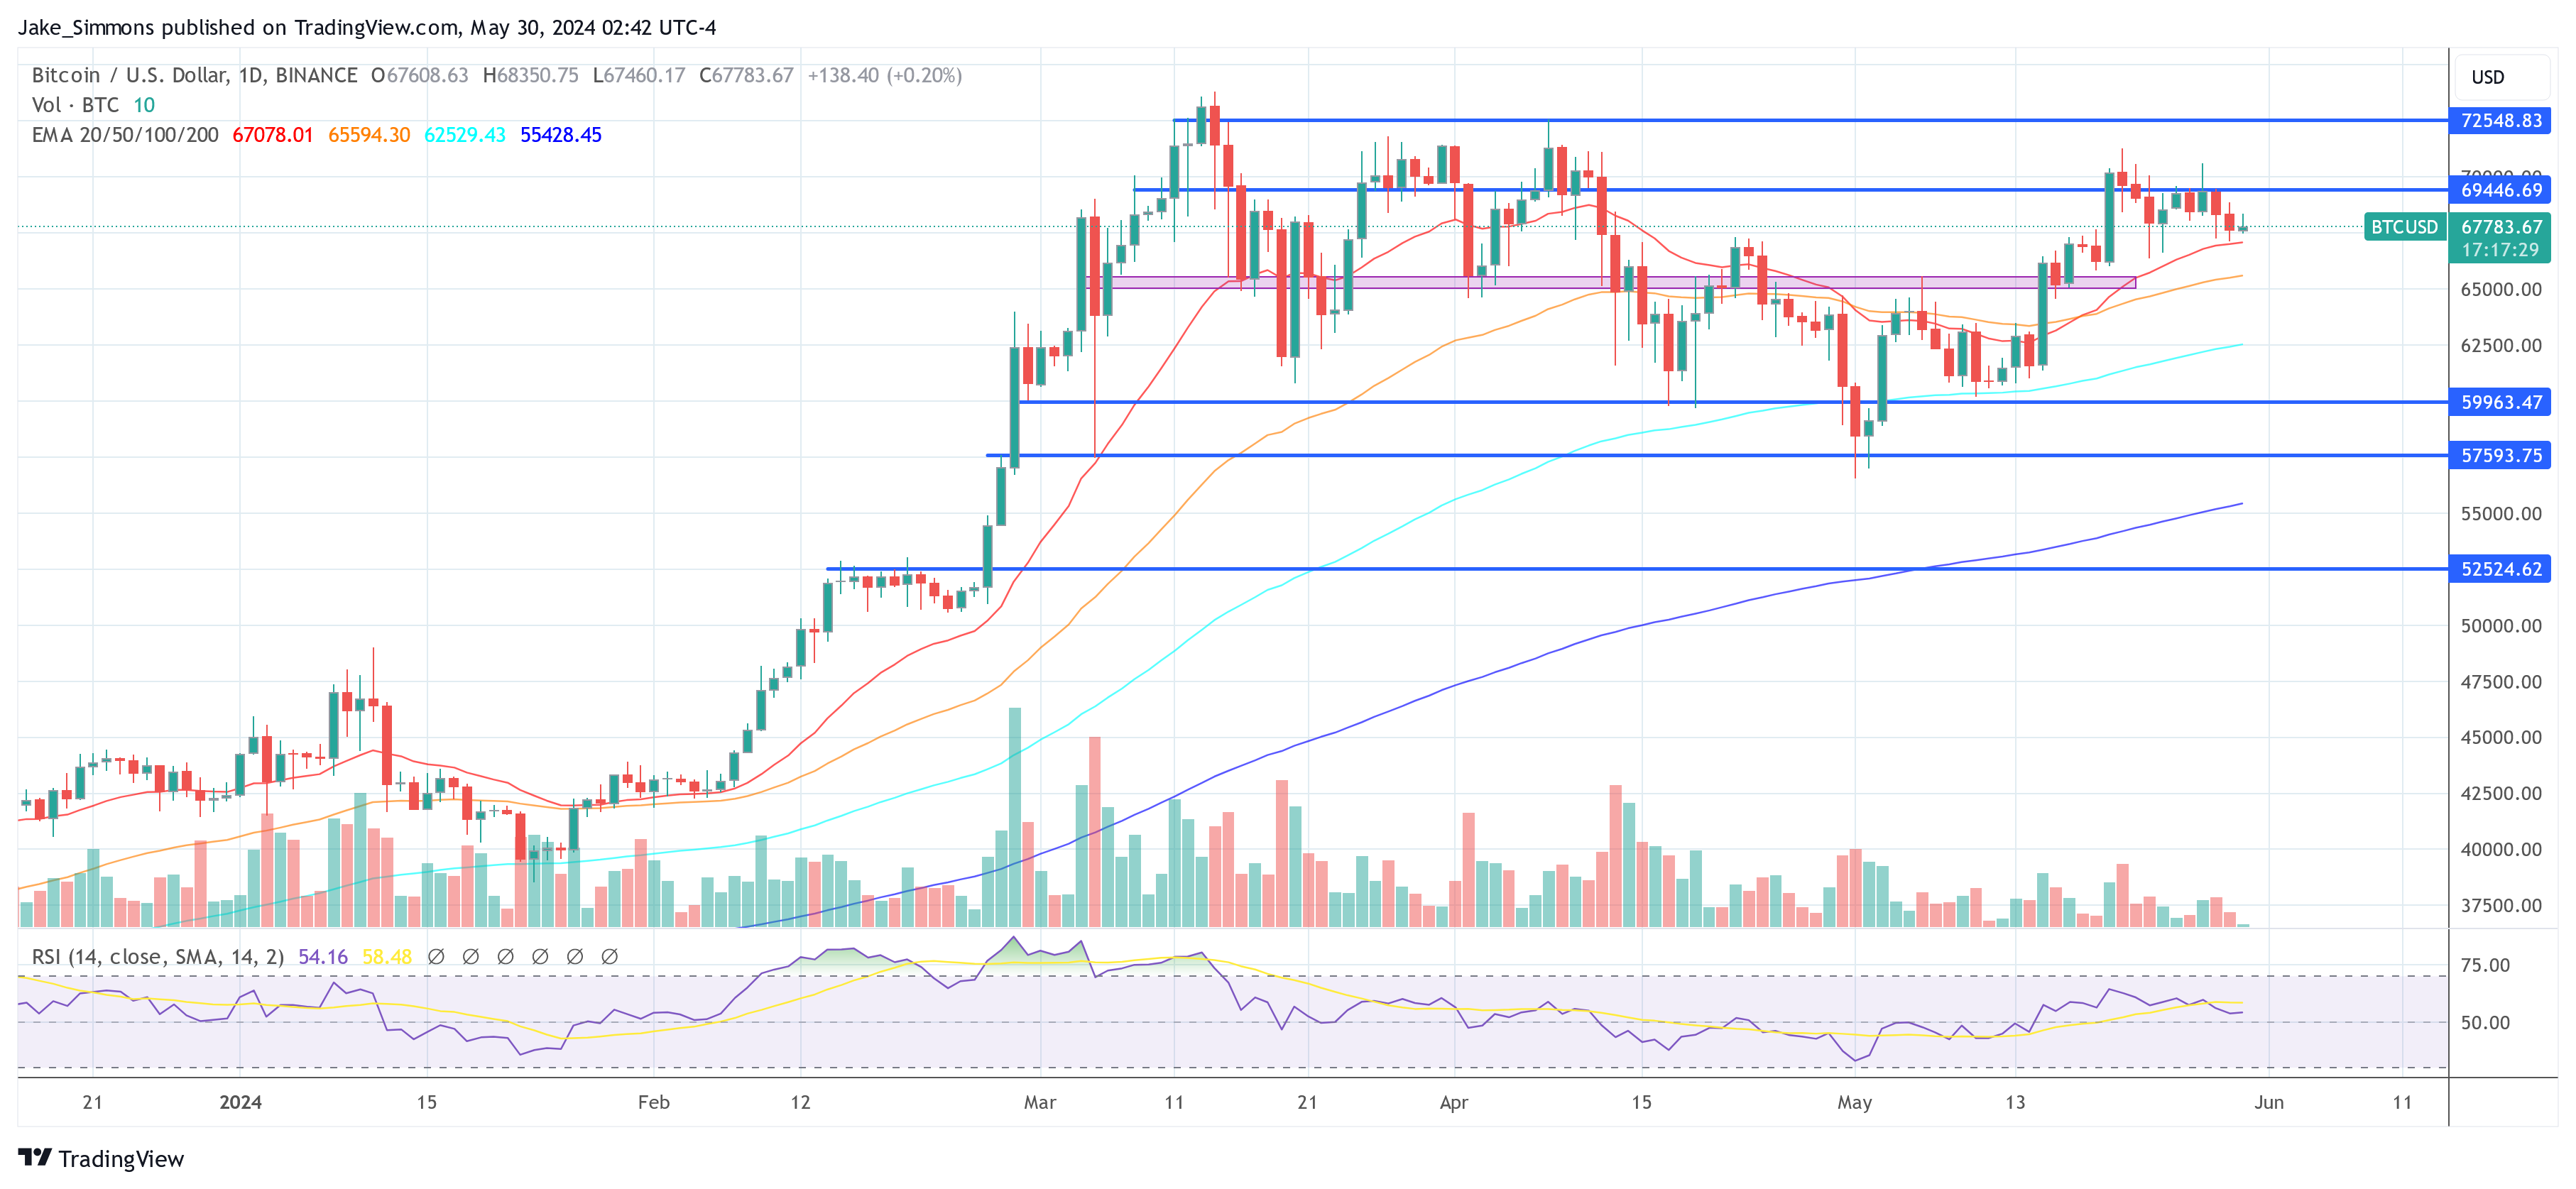
At press time, BTC traded at $67,783.
Bitcoin price
Disclaimer: For information purposes only. Past performance is not indicative of future results.
placeholder
Gold Price Analysis Today | Forex Gold Analysis | XAU/USD Analysis - October 20, 2026Get the latest gold price analysis, forex gold insights, and XAU/USD analysis for October 20, 2026. Read on for the details.
Author  Mitrade
Oct 20, Tue
Get the latest gold price analysis, forex gold insights, and XAU/USD analysis for October 20, 2026. Read on for the details.
placeholder
Dollar presses 102 as the 10-year yield sits at 5.14% — and October hike odds are only 17%The dollar index closed at 101.99 (+0.20%) on Monday after briefly topping 102.07, while the 10-year Treasury yield rose to 5.14% and the 2-year hit 4.774% — yet futures price only about a 17% chance of a hike at the October 27-28 FOMC, versus roughly 90% for December. The driver is a global bond selloff, not a Fed repricing: France's 10-year OAT jumped to 4.84% ~ 4.94% and the OAT-Bund spread widened to 140 ~ 146bp. Here are the levels, the cross-asset read-through and what to watch.
Author  Irene Q.
Oct 20, Tue
The dollar index closed at 101.99 (+0.20%) on Monday after briefly topping 102.07, while the 10-year Treasury yield rose to 5.14% and the 2-year hit 4.774% — yet futures price only about a 17% chance of a hike at the October 27-28 FOMC, versus roughly 90% for December. The driver is a global bond selloff, not a Fed repricing: France's 10-year OAT jumped to 4.84% ~ 4.94% and the OAT-Bund spread widened to 140 ~ 146bp. Here are the levels, the cross-asset read-through and what to watch.
placeholder
Gold Price Analysis Today | Forex Gold Analysis | XAU/USD Analysis - October 22, 2026Get the latest gold price analysis, forex gold insights, and XAU/USD analysis for October 22, 2026. Read on for the details.
Author  Mitrade
Yesterday 01: 58
Get the latest gold price analysis, forex gold insights, and XAU/USD analysis for October 22, 2026. Read on for the details.
placeholder
The Fed will sit still on October 28 — but 100 of 100 economists now expect a December hikeA Reuters poll run October 16-20 found 94 of 100 economists expecting the Fed to hold at 3.75-4.00% on October 28 — and all 100 expecting a hike in December, against less than half a month earlier. The market is close to the same price, with CME FedWatch at roughly 17% for October and 82.8% for December. With the Fed in blackout since October 17, here are the five dates that decide the rest of the year, what each one is priced for, and the two directions each can take.
Author  Irene Q.
Yesterday 06: 28
A Reuters poll run October 16-20 found 94 of 100 economists expecting the Fed to hold at 3.75-4.00% on October 28 — and all 100 expecting a hike in December, against less than half a month earlier. The market is close to the same price, with CME FedWatch at roughly 17% for October and 82.8% for December. With the Fed in blackout since October 17, here are the five dates that decide the rest of the year, what each one is priced for, and the two directions each can take.
placeholder
Gold Price Analysis Today | Forex Gold Analysis | XAU/USD Analysis - October 23, 2026Get the latest gold price analysis, forex gold insights, and XAU/USD analysis for October 23, 2026. Read on for the details.
Author  Mitrade
7 hours ago
Get the latest gold price analysis, forex gold insights, and XAU/USD analysis for October 23, 2026. Read on for the details.
goTop
quote