


New Zealand Dollar falls toward 18-month lows following RBNZ Q4 Inflation Expectations QoQ
- The New Zealand Dollar weakens after Q4 RBNZ two-year inflation expectations rise slightly to 2.36%.
- Hotter US inflation and hawkish Fed remarks boost market bets for a December interest rate hike.
- Traders now await Tuesday’s US October Retail Sales report, which is forecast to show modest monthly growth.
NZD/USD loses ground for the sixth consecutive day, trading around 0.5490 during Asian hours on Tuesday. The pair is depreciating toward near 18-month lows as the New Zealand Dollar (NZD) remains subdued following the release of the Reserve Bank of New Zealand (RBNZ) Inflation Expectations survey. For the fourth quarter of 2026, two-year inflation expectations edged up slightly to 2.36% from 2.34% in the third quarter, while one-year forward projections came in at 2.92%.
The NZD/USD loses ground as the US Dollar (USD) gains strength following a hotter-than-expected US inflation report last week, which revived expectations that the Federal Reserve (Fed) will raise interest rates again in December. Reinforcing this hawkish outlook, Kansas City Fed President Jeffrey Schmid stated on Sunday that inflation remains too high and further effort is needed to curb price pressures.
According to the CME FedWatch tool, markets are now pricing in a 95.7% probability of a 25-basis-point rate hike and a 4.3% chance of a 50-basis-point increase at the Fed's December 8–9 policy meeting.
Looking ahead, traders are awaiting the US October Retail Sales report due later on Tuesday, where headline sales are expected to rise by 0.2% month-over-month, and sales excluding autos are projected to increase by 0.4%.
Technical Analysis:
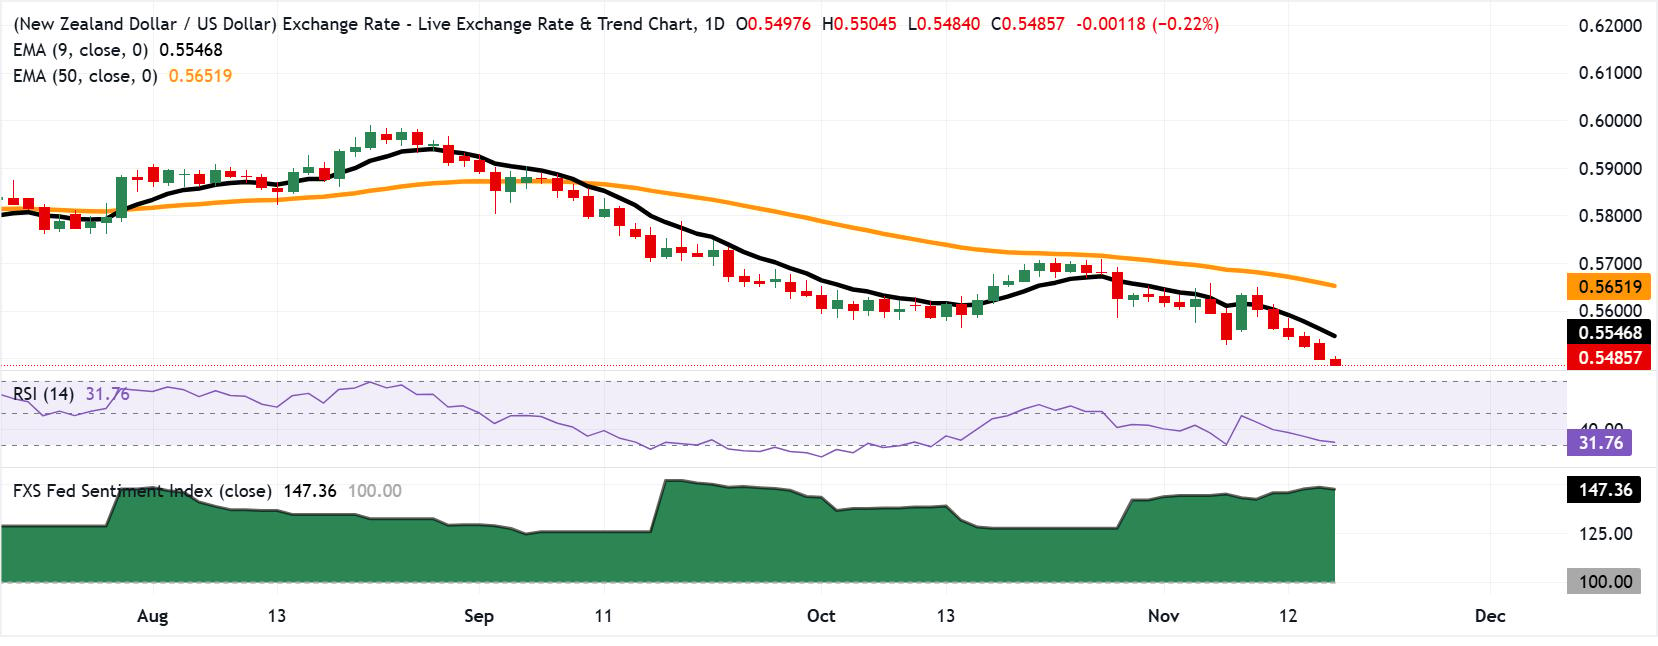
In the daily chart, NZD/USD trades at 0.5490, extending its slide beneath both the nine-day and 50-day Exponential Moving Averages (EMAs), which anchors a clear bearish near-term bias. The pair remains compressed below the moving averages, suggesting upside attempts are being capped by dynamic resistance, while the 14-day Relative Strength Index (RSI) hovers near the 30 area, hinting at downside pressure that is approaching, but not yet firmly in, oversold territory.
On the topside, initial resistance is located at the nine-day EMA at 0.5546, followed by the 50-day EMA at 0.5651, where any recovery would likely stall unless momentum improves decisively. Above these, a more substantial barrier emerges at the horizontal level of 0.5850, ahead of a stronger medium-term cap near 0.6100, which together define the broader resistance band that the kiwi would need to reclaim to challenge the prevailing bearish structure.
(The technical analysis of this story was written with the help of an AI tool. Know more.)
New Zealand Dollar FAQs
The New Zealand Dollar (NZD), also known as the Kiwi, is a well-known traded currency among investors. Its value is broadly determined by the health of the New Zealand economy and the country’s central bank policy. Still, there are some unique particularities that also can make NZD move. The performance of the Chinese economy tends to move the Kiwi because China is New Zealand’s biggest trading partner. Bad news for the Chinese economy likely means less New Zealand exports to the country, hitting the economy and thus its currency. Another factor moving NZD is dairy prices as the dairy industry is New Zealand’s main export. High dairy prices boost export income, contributing positively to the economy and thus to the NZD.
The Reserve Bank of New Zealand (RBNZ) aims to achieve and maintain an inflation rate between 1% and 3% over the medium term, with a focus to keep it near the 2% mid-point. To this end, the bank sets an appropriate level of interest rates. When inflation is too high, the RBNZ will increase interest rates to cool the economy, but the move will also make bond yields higher, increasing investors’ appeal to invest in the country and thus boosting NZD. On the contrary, lower interest rates tend to weaken NZD. The so-called rate differential, or how rates in New Zealand are or are expected to be compared to the ones set by the US Federal Reserve, can also play a key role in moving the NZD/USD pair.
Macroeconomic data releases in New Zealand are key to assess the state of the economy and can impact the New Zealand Dollar’s (NZD) valuation. A strong economy, based on high economic growth, low unemployment and high confidence is good for NZD. High economic growth attracts foreign investment and may encourage the Reserve Bank of New Zealand to increase interest rates, if this economic strength comes together with elevated inflation. Conversely, if economic data is weak, NZD is likely to depreciate.
The New Zealand Dollar (NZD) tends to strengthen during risk-on periods, or when investors perceive that broader market risks are low and are optimistic about growth. This tends to lead to a more favorable outlook for commodities and so-called ‘commodity currencies’ such as the Kiwi. Conversely, NZD tends to weaken at times of market turbulence or economic uncertainty as investors tend to sell higher-risk assets and flee to the more-stable safe havens.
Recommended Articles


