

Intel Tumbles 7% to Retest $50 Level, Risking 60% Plunge If Support Breaks

Source Tradingkey

TradingKey - Intel shares tumbled 7%, retesting the critical $50 support level, with technical indicators warning that a breakdown could trigger a steep plunge of over 60%.

On November 16, Eastern Time, Intel (INTC) shares tumbled 7.02% in a single session to close at $55.47, essentially erasing the gains from its post-plunge rebound. Over the past month, Intel shares have slid continuously from their mid-October high of $90, with a cumulative drop of as much as 40%.

Intel's recent persistent slump has been primarily driven by a confluence of headwinds, including weaker-than-expected fourth-quarter guidance, cash flow and debt pressures, and litigation risks. Notably, while some figures in Intel's previously released financial report met expectations, the fourth-quarter guidance it issued was deeply disappointing, falling well below market consensus.

Following the sharp single-day drop in late October, investors recently filed a class-action lawsuit against Intel and its executives in a California federal court, alleging that prior to an equity offering of up to $23 billion in August, the company failed to adequately disclose slowing PC sales and potential transformation risks to the market, further undermining the confidence of institutional and retail investors alike.

In addition to internal headwinds, Intel also faces external shocks. Against the backdrop of the current macroeconomic interest rate environment and the broader technical correction across U.S. tech stocks, capital has aggressively de-risked from legacy IDM giants that lack near-term profit momentum and are in long-term transition periods, prompting sustained selling pressure.

Under these pressures, Intel's stock price is once again nearing the critical psychological and technical support level of $50. From the weekly and monthly chart structures, $50 is not only a psychological round-number threshold, but also an important defense zone for institutional capital over the past several years. If this support level is breached on heavy volume, it will completely shatter bullish confidence and trigger massive programmatic stop-loss and options hedging sell orders across the market, further amplifying downside volatility and even risking a deeper correction.

From a technical analysis perspective, if Intel's stock price breaks below $50, it could fall by approximately another 60%, heading down to test the $20 support line, which formed the bottom between August 2024 and August 2025. Although bearish sentiment is heavy, a direct plunge toward $20 in the near term would typically require a comprehensive, systemic collapse in fundamentals—such as a U.S. stock market crash, the forced full suspension of its foundry strategy, or a liquidity crisis.
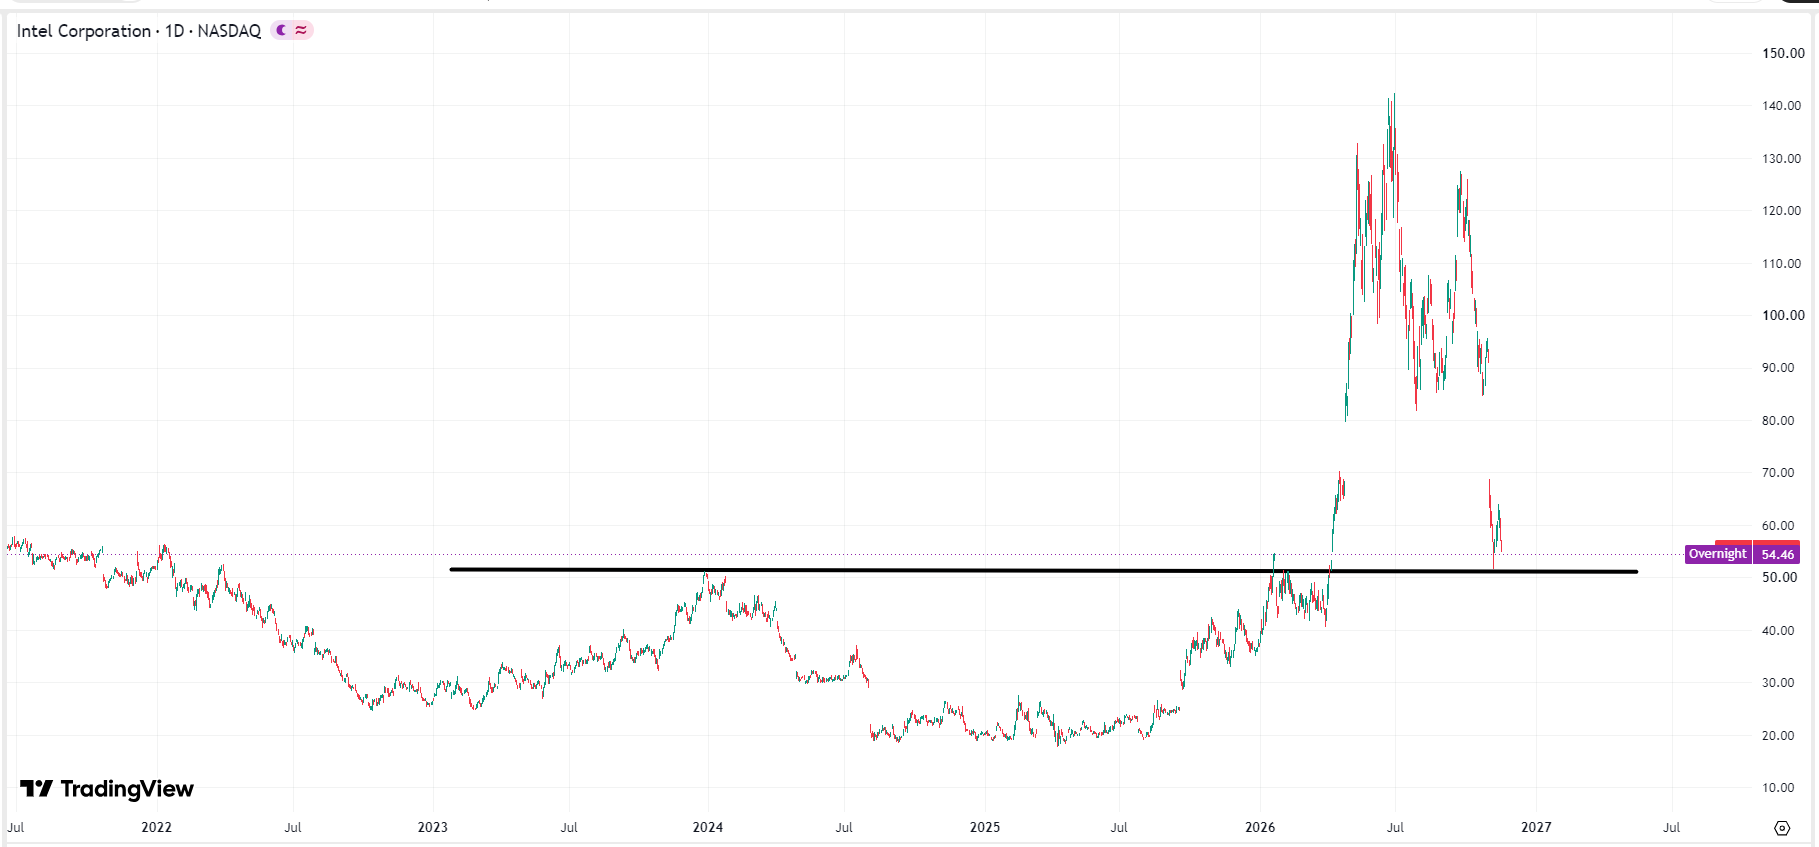
intc-price-ea3e7ebe13314ff589dfe89e25356b8aIntel stock price chart, Source: TradingView

Disclaimer: For information purposes only. Past performance is not indicative of future results.
placeholder
Nvidia reports tomorrow with an interim CEO — $108 billion is the easy numberNvidia closed at 162.85 on Friday, down 12.75% on the week and 32% below its 6 October record, with market value down to $3.92 trillion. The Q3 bar is $108 billion ±2%, and consensus already sits at $108.7 ~ 108.8 billion, so the revenue line is not where the surprise lives. The number that decides the reaction is the 71 ~ 72% Q4 gross-margin trough, followed by a Q4 guide against a $124.9 billion consensus. This piece prices the print, marks the 158.39 line and lays out the three scenarios in a table.
Author  Irene Q.
Yesterday 02: 11
Nvidia closed at 162.85 on Friday, down 12.75% on the week and 32% below its 6 October record, with market value down to $3.92 trillion. The Q3 bar is $108 billion ±2%, and consensus already sits at $108.7 ~ 108.8 billion, so the revenue line is not where the surprise lives. The number that decides the reaction is the 71 ~ 72% Q4 gross-margin trough, followed by a Q4 guide against a $124.9 billion consensus. This piece prices the print, marks the 158.39 line and lays out the three scenarios in a table.
placeholder
Anthropic is six times oversubscribed at $1.4 trillion while Nvidia is down 32% — the AI trade has two pricesAnthropic lists on Nasdaq as ANT on Thursday at $70 ~ $78 a share, raising up to $64.4 billion at a target valuation near $1.4 trillion, and the book is reportedly six times covered. In the same six weeks, Nvidia has fallen 32% and the QQQ is 10.9% below its October peak. Private capital and public markets are marking the same AI complex at two very different prices. This piece separates the two books: what the S-1 shows, who is anchoring the $26 billion private placement, and what Thursday's debut would have to do to change the public tape.
Author  Irene Q.
Yesterday 02: 27
Anthropic lists on Nasdaq as ANT on Thursday at $70 ~ $78 a share, raising up to $64.4 billion at a target valuation near $1.4 trillion, and the book is reportedly six times covered. In the same six weeks, Nvidia has fallen 32% and the QQQ is 10.9% below its October peak. Private capital and public markets are marking the same AI complex at two very different prices. This piece separates the two books: what the S-1 shows, who is anchoring the $26 billion private placement, and what Thursday's debut would have to do to change the public tape.
placeholder
Weekly Report: The index rose 2.5% while Nvidia fell 12.7% — two equity divergences, one should closeThe S&P 500 rose 2.51% to 7,561.67 and the QQQ rose 3.63% to 679.89 last week, while Nvidia fell 12.75% to 162.85 — a sixth straight weekly loss and 32% below its October record. In the same five sessions, energy equities rose 5.42% while WTI fell 2.52%. Both pairs normally move together (60-day correlations of +0.64 and +0.58). This report ranks which divergence closes first, with the trigger for each.
Author  Irene Q.
Yesterday 02: 35
The S&P 500 rose 2.51% to 7,561.67 and the QQQ rose 3.63% to 679.89 last week, while Nvidia fell 12.75% to 162.85 — a sixth straight weekly loss and 32% below its October record. In the same five sessions, energy equities rose 5.42% while WTI fell 2.52%. Both pairs normally move together (60-day correlations of +0.64 and +0.58). This report ranks which divergence closes first, with the trigger for each.
placeholder
Gold Price Analysis Today | Forex Gold Analysis | XAU/USD Analysis - November 16, 2026Get the latest gold price analysis, forex gold insights, and XAU/USD analysis for November 16, 2026. Read on for the details.
Author  Mitrade
Yesterday 02: 45
Get the latest gold price analysis, forex gold insights, and XAU/USD analysis for November 16, 2026. Read on for the details.
placeholder
Weekly Report: DXY 103.41, 10-year 5.15%, AUD carry 3bp — three FX regimes flipped in one weekThe dollar index rose 1.09% to 103.41, a 19-month high, while the US 10-year closed at 5.154% and the Australia-US two-year spread collapsed to about 3 basis points from 36. EURUSD fell 1.59% to 1.1024, USDJPY rose 1.51% to 159.78 and AUDUSD fell 1.79% to 0.6764, a 10-month low. Three FX regimes — the broad dollar, the US rate level and the Australian carry premium — flipped in the same week. This report marks the thresholds, ranks which one can flip back first, and lists the week's calendar.
Author  Irene Q.
Yesterday 03: 26
The dollar index rose 1.09% to 103.41, a 19-month high, while the US 10-year closed at 5.154% and the Australia-US two-year spread collapsed to about 3 basis points from 36. EURUSD fell 1.59% to 1.1024, USDJPY rose 1.51% to 159.78 and AUDUSD fell 1.79% to 0.6764, a 10-month low. Three FX regimes — the broad dollar, the US rate level and the Australian carry premium — flipped in the same week. This report marks the thresholds, ranks which one can flip back first, and lists the week's calendar.
goTop
quote