

Ethereum (ETHUSD) Is down 1.00% on Oct 24: What Do On-Chain Data and Market Sentiment Show?

Source Tradingkey

Ethereum (ETHUSD) is down 1.00% at Oct 24 21:10(ET), now at $2375.15, with a 7-day down of 1.82%.
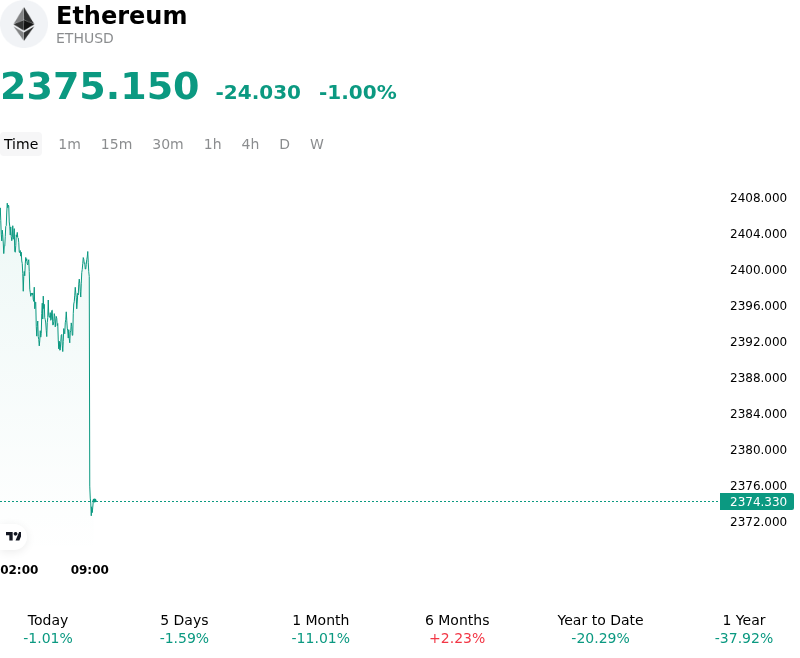
SummaryOverview

What is driving Ethereum (ETHUSD)’s stock price down today?

Elevated U.S. Treasury yields and ongoing macroeconomic uncertainty continued to pressure risk-sensitive digital assets, driving market participants to reduce exposure to high-beta tokens like Ethereum. Tightening financial conditions and persistent inflation concerns bolstered real yields, attracting institutional capital into sovereign debt instruments and reducing short-term risk appetite across broader financial markets. In addition, institutional momentum via spot Ether exchange-traded funds has remained muted following a period of net monthly redemptions. The lack of sustained spot ETF buying removed a key structural tailwind, leaving spot order books vulnerable to incremental selling pressure from institutional rebalancing.

Derivatives market dynamics further accelerated the downward momentum during the trading session. Ethereum faced technical resistance near its short-term exponential moving averages, failing to sustain upward momentum and triggering localized long liquidations in perpetual futures markets. As key short-term price levels were breached, automated stop-loss orders and deleveraging by leveraged market participants added downside friction, shifting market microstructure toward derivative-led selling.

On-chain indicators highlight a market characterized by near-term liquidity constraints despite solid underlying network security. While long-term staking metrics remain robust—with a substantial portion of total circulating supply locked in validator contracts—immediate spot availability was impacted by selective profit-taking from early holders. Furthermore, minor timing adjustments across protocol testnet deployments moderated short-term speculative enthusiasm, leading swing traders to adopt a more conservative stance.

The recent price action reflects a temporary macro-led liquidity repricing and leverage unwind rather than a fundamental erosion of Ethereum's layer-one utility. Investors and portfolio managers are closely watching global macro liquidity conditions, U.S. Federal Reserve policy signals, and the stabilization of spot ETF flows as critical precursors for renewed capital deployment into smart contract platforms.

Technical Analysis of Ethereum (ETHUSD)

Technically, Ethereum (ETHUSD) shows a MACD (12,26,9) value of -17.437, indicating a sell signal. The RSI at 39.837 suggests neutral condition and the Williams %R at 77.988 suggests sell condition. Please monitor closely.
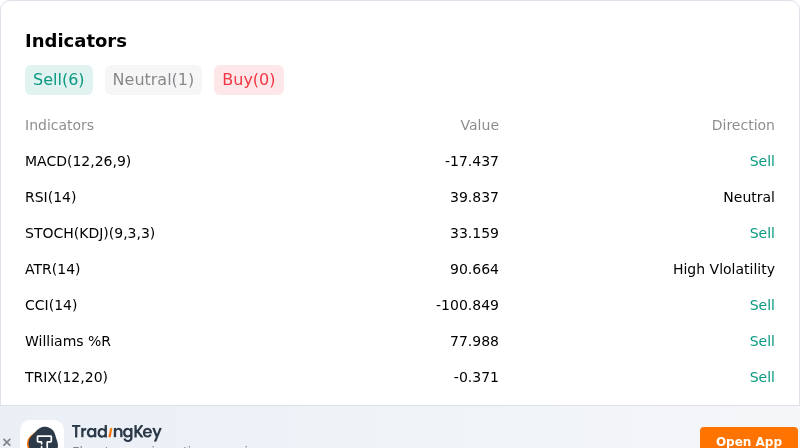
IndicatorAnalysis

More details about Ethereum (ETHUSD)

Recent Events and Risks:

  • Institutional Spot ETF Outflows: Sustained redemptions from U.S. spot Ethereum ETFs—highlighted by recent single-day net withdrawals exceeding $110 million and multi-week redemptions topping $319 million—have eroded vital spot market buy-side liquidity and severely weakened institutional sentiment.
  • Derivatives Liquidation Cascades: Heavy concentration of leveraged long positions near the critical $2,350 to $2,400 support cluster leaves ETH highly susceptible to cascading forced sell-offs if market pressure breaks key technical floors.
  • Protocol Upgrade Delay and Security Concerns: Core developers postponed the Hoodi testnet activation for the Glamsterdam upgrade to analyze potential smart-contract compatibility risks and security issues associated with EIP-8037, adding technical uncertainty.
  • Whale Offloading and Exchange Inflows: On-chain tracking reported early investors and whale addresses depositing thousands of ETH to centralized exchange wallets, adding substantial spot-side supply pressure during periods of thin market liquidity.
Disclaimer: For information purposes only. Past performance is not indicative of future results.
placeholder
Dollar presses 102 as the 10-year yield sits at 5.14% — and October hike odds are only 17%The dollar index closed at 101.99 (+0.20%) on Monday after briefly topping 102.07, while the 10-year Treasury yield rose to 5.14% and the 2-year hit 4.774% — yet futures price only about a 17% chance of a hike at the October 27-28 FOMC, versus roughly 90% for December. The driver is a global bond selloff, not a Fed repricing: France's 10-year OAT jumped to 4.84% ~ 4.94% and the OAT-Bund spread widened to 140 ~ 146bp. Here are the levels, the cross-asset read-through and what to watch.
Author  Irene Q.
Oct 20, Tue
The dollar index closed at 101.99 (+0.20%) on Monday after briefly topping 102.07, while the 10-year Treasury yield rose to 5.14% and the 2-year hit 4.774% — yet futures price only about a 17% chance of a hike at the October 27-28 FOMC, versus roughly 90% for December. The driver is a global bond selloff, not a Fed repricing: France's 10-year OAT jumped to 4.84% ~ 4.94% and the OAT-Bund spread widened to 140 ~ 146bp. Here are the levels, the cross-asset read-through and what to watch.
placeholder
Meta's AI bill just hit $145 billion — and it issued a new share class to pay for itMeta reported record third-quarter revenue of $64.60 billion, up 26% from a year earlier, and raised full-year 2026 capital expenditure guidance to $135-145 billion from $130-145 billion. To fund that build-out without touching Mark Zuckerberg's voting control, the company announced a 2-for-1 stock split that hands every Class A holder a new non-voting Class C share. Here are the four lines that matter, the peer group that is being re-rated alongside it, and the bull and bear cases.
Author  Irene Q.
Oct 22, Thu
Meta reported record third-quarter revenue of $64.60 billion, up 26% from a year earlier, and raised full-year 2026 capital expenditure guidance to $135-145 billion from $130-145 billion. To fund that build-out without touching Mark Zuckerberg's voting control, the company announced a 2-for-1 stock split that hands every Class A holder a new non-voting Class C share. Here are the four lines that matter, the peer group that is being re-rated alongside it, and the bull and bear cases.
placeholder
The Fed will sit still on October 28 — but 100 of 100 economists now expect a December hikeA Reuters poll run October 16-20 found 94 of 100 economists expecting the Fed to hold at 3.75-4.00% on October 28 — and all 100 expecting a hike in December, against less than half a month earlier. The market is close to the same price, with CME FedWatch at roughly 17% for October and 82.8% for December. With the Fed in blackout since October 17, here are the five dates that decide the rest of the year, what each one is priced for, and the two directions each can take.
Author  Irene Q.
Oct 22, Thu
A Reuters poll run October 16-20 found 94 of 100 economists expecting the Fed to hold at 3.75-4.00% on October 28 — and all 100 expecting a hike in December, against less than half a month earlier. The market is close to the same price, with CME FedWatch at roughly 17% for October and 82.8% for December. With the Fed in blackout since October 17, here are the five dates that decide the rest of the year, what each one is priced for, and the two directions each can take.
placeholder
Gold Price Analysis Today | Forex Gold Analysis | XAU/USD Analysis - October 23, 2026Get the latest gold price analysis, forex gold insights, and XAU/USD analysis for October 23, 2026. Read on for the details.
Author  Mitrade
Yesterday 02: 56
Get the latest gold price analysis, forex gold insights, and XAU/USD analysis for October 23, 2026. Read on for the details.
placeholder
Nasdaq closes at 26,008.86 — 8.9 points above 26,000, and the credit market never blinkedThe Nasdaq Composite fell 2.60% to 26,008.86 on October 22, its worst session since June, as Meta sank 6.98% on 2026 capex guidance of $135–145 billion. But the equal-weight S&P 500 rose 0.73%, high-yield credit was flat and 10-year yields fell 20 basis points. This was an AI de-rating, not a risk-off event — here is the transmission chain, the 29,000 / 28,200 levels and what would prove it wrong.
Author  Irene Q.
20 hours ago
The Nasdaq Composite fell 2.60% to 26,008.86 on October 22, its worst session since June, as Meta sank 6.98% on 2026 capex guidance of $135–145 billion. But the equal-weight S&P 500 rose 0.73%, high-yield credit was flat and 10-year yields fell 20 basis points. This was an AI de-rating, not a risk-off event — here is the transmission chain, the 29,000 / 28,200 levels and what would prove it wrong.
goTop
quote