

Silver Price Forecast: US Inflation Pressures Heat Up as $55 Level Lost, Is Silver's Next Target $50?

Source Tradingkey

TradingKey - As of October 22, silver prices (XAGUSD) plunged 5.82% on the day, hitting an intraday low of $54.48 and closing at $54.57, meaning the key support level of $55 was lost, opening up further downside room for silver prices. Inflation concerns triggered by rising international oil prices, alongside expectations of further Fed rate hikes by the end of the year, were the main factors weighing on silver prices.

Rising Oil Prices Heighten Inflation Fears

From a fundamental perspective, the key factor driving silver prices recently has been oil prices.

Tensions in the Middle East have flared up again recently. Yemen's Houthi rebels launched a new round of attacks on Saudi energy facilities, sparking market concerns over crude oil supply disruptions in the Middle East and pushing Brent crude prices to their highest level since May.

Rising oil prices further heighten the risk of persistently elevated US inflation. Previously released US September CPI and PPI data both came in higher than market expectations, with rising energy prices serving as a key driver behind the inflation rebound. Persistent price pressures mean the Federal Reserve may need to keep interest rates higher for longer, thereby increasing the opportunity cost of holding non-yielding silver.

According to the CME FedWatch Tool, the market generally expects the Federal Reserve to keep interest rates unchanged at its October 27-28 meeting, but the probability of a 25-basis-point rate hike in December remains at around 86%. In addition, the US PCE inflation data, a key focus for the Fed, will be released on October 29, and the results could further influence market expectations regarding the rate path by the end of the year.

Silver Price Technical Analysis
xag-ee081130727848d88e54f088fa1ca15c

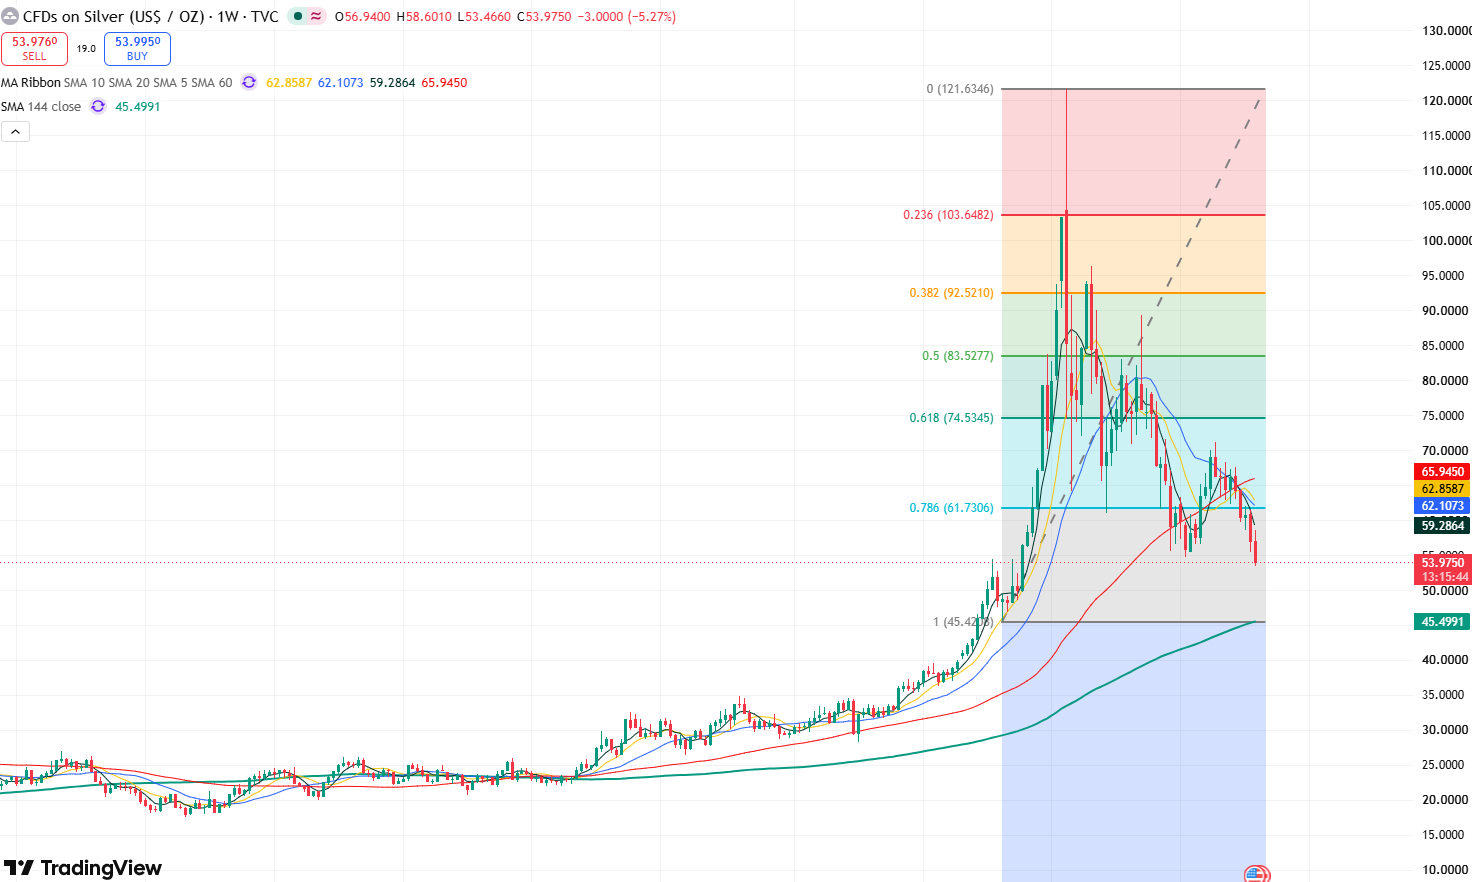
Silver price weekly chart, Source: TradingView

Looking at silver's weekly chart, after reaching an all-time high of $121.64 earlier this year, prices have continued to pull back. As the peaks of recent rebounds have progressively lowered, the candlestick pattern shows a consistent trend of lower highs and lower lows, indicating that silver's overall trajectory remains downward.

Currently, silver has broken below key support at $55, with the lows of the overall candlestick trend moving lower once again. This indicates that the broader downtrend is continuing, opening up space for deeper downside. The first level to watch is $50; if this level fails to hold, silver prices may drop further toward the $45 area.

To the upside, if silver reclaims $55, a double bottom pattern may form on the weekly chart, significantly bolstering bullish momentum and potentially driving prices to test the $60 mark. A decisive break and hold above $60 would see silver challenge its previous rebound high of $71.16.

Disclaimer: For information purposes only. Past performance is not indicative of future results.
placeholder
Dollar presses 102 as the 10-year yield sits at 5.14% — and October hike odds are only 17%The dollar index closed at 101.99 (+0.20%) on Monday after briefly topping 102.07, while the 10-year Treasury yield rose to 5.14% and the 2-year hit 4.774% — yet futures price only about a 17% chance of a hike at the October 27-28 FOMC, versus roughly 90% for December. The driver is a global bond selloff, not a Fed repricing: France's 10-year OAT jumped to 4.84% ~ 4.94% and the OAT-Bund spread widened to 140 ~ 146bp. Here are the levels, the cross-asset read-through and what to watch.
Author  Irene Q.
Oct 20, Tue
The dollar index closed at 101.99 (+0.20%) on Monday after briefly topping 102.07, while the 10-year Treasury yield rose to 5.14% and the 2-year hit 4.774% — yet futures price only about a 17% chance of a hike at the October 27-28 FOMC, versus roughly 90% for December. The driver is a global bond selloff, not a Fed repricing: France's 10-year OAT jumped to 4.84% ~ 4.94% and the OAT-Bund spread widened to 140 ~ 146bp. Here are the levels, the cross-asset read-through and what to watch.
placeholder
Meta's AI bill just hit $145 billion — and it issued a new share class to pay for itMeta reported record third-quarter revenue of $64.60 billion, up 26% from a year earlier, and raised full-year 2026 capital expenditure guidance to $135-145 billion from $130-145 billion. To fund that build-out without touching Mark Zuckerberg's voting control, the company announced a 2-for-1 stock split that hands every Class A holder a new non-voting Class C share. Here are the four lines that matter, the peer group that is being re-rated alongside it, and the bull and bear cases.
Author  Irene Q.
Oct 22, Thu
Meta reported record third-quarter revenue of $64.60 billion, up 26% from a year earlier, and raised full-year 2026 capital expenditure guidance to $135-145 billion from $130-145 billion. To fund that build-out without touching Mark Zuckerberg's voting control, the company announced a 2-for-1 stock split that hands every Class A holder a new non-voting Class C share. Here are the four lines that matter, the peer group that is being re-rated alongside it, and the bull and bear cases.
placeholder
The Fed will sit still on October 28 — but 100 of 100 economists now expect a December hikeA Reuters poll run October 16-20 found 94 of 100 economists expecting the Fed to hold at 3.75-4.00% on October 28 — and all 100 expecting a hike in December, against less than half a month earlier. The market is close to the same price, with CME FedWatch at roughly 17% for October and 82.8% for December. With the Fed in blackout since October 17, here are the five dates that decide the rest of the year, what each one is priced for, and the two directions each can take.
Author  Irene Q.
Oct 22, Thu
A Reuters poll run October 16-20 found 94 of 100 economists expecting the Fed to hold at 3.75-4.00% on October 28 — and all 100 expecting a hike in December, against less than half a month earlier. The market is close to the same price, with CME FedWatch at roughly 17% for October and 82.8% for December. With the Fed in blackout since October 17, here are the five dates that decide the rest of the year, what each one is priced for, and the two directions each can take.
placeholder
Gold Price Analysis Today | Forex Gold Analysis | XAU/USD Analysis - October 23, 2026Get the latest gold price analysis, forex gold insights, and XAU/USD analysis for October 23, 2026. Read on for the details.
Author  Mitrade
Yesterday 02: 56
Get the latest gold price analysis, forex gold insights, and XAU/USD analysis for October 23, 2026. Read on for the details.
placeholder
Nasdaq closes at 26,008.86 — 8.9 points above 26,000, and the credit market never blinkedThe Nasdaq Composite fell 2.60% to 26,008.86 on October 22, its worst session since June, as Meta sank 6.98% on 2026 capex guidance of $135–145 billion. But the equal-weight S&P 500 rose 0.73%, high-yield credit was flat and 10-year yields fell 20 basis points. This was an AI de-rating, not a risk-off event — here is the transmission chain, the 29,000 / 28,200 levels and what would prove it wrong.
Author  Irene Q.
Yesterday 06: 39
The Nasdaq Composite fell 2.60% to 26,008.86 on October 22, its worst session since June, as Meta sank 6.98% on 2026 capex guidance of $135–145 billion. But the equal-weight S&P 500 rose 0.73%, high-yield credit was flat and 10-year yields fell 20 basis points. This was an AI de-rating, not a risk-off event — here is the transmission chain, the 29,000 / 28,200 levels and what would prove it wrong.
goTop
quote