

Solana (SOLUSD) Is down 2.64% on Oct 13: What Are the Risk Factors?

Source Tradingkey

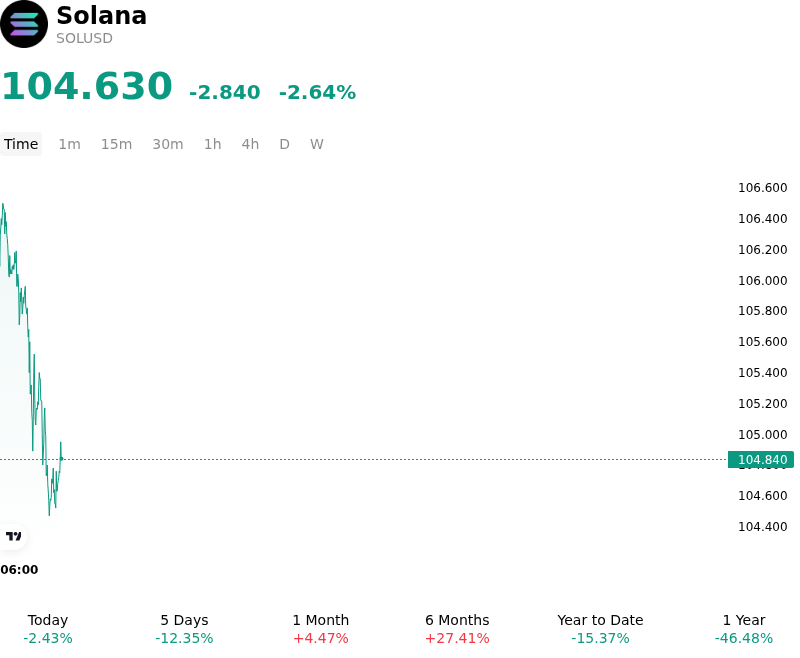
Solana (SOLUSD) is down 2.64% at Oct 13 20:05(ET), now at $104.63, with a 7-day down of 12.81%.
SummaryOverview

What is driving Solana (SOLUSD)’s stock price down today?

The pullback in Solana reflects a confluence of concentrated spot supply overhang, slowing institutional vehicle inflows, and broader risk-off sentiment across high-beta digital assets. A primary catalyst driving selling pressure was the aggressive liquidation of digital asset reserves by corporate treasury entity SkyAI, which offloaded significant spot SOL holdings onto major exchanges to finance a large-scale cash tender offer and share buyback program. This sudden influx of exchange-bound liquidity generated immediate order book imbalance, creating a temporary supply absorption hurdle for market makers. Compounding this sell-side pressure, U.S. spot Solana funds recorded notable weekly net outflows, signaling a shift toward risk-averse positioning among institutional allocators.

Macroeconomic headwinds further constrained risk appetite across the broader cryptocurrency market. Elevated U.S. Treasury yields and hawkish Federal Reserve rate policy expectations continued to tighten global liquidity conditions, discouraging aggressive capital deployment into layer-one tokens. As SOL slipped below key short-term technical support thresholds and moving averages, long-side leverage in the derivatives market unwound rapidly. The resulting cascade of long liquidations amplified downside velocity and widened bid-ask spreads across central limit order books, forcing systematic market participants to reduce inventory risk.

Despite the temporary weakness, the move appears to be an event-driven liquidity adjustment rather than a structural deterioration of Solana ecosystem fundamentals. While corporate reserve liquidations created short-term spot drag, expanding international product availability—highlighted by new spot Solana ETF listings on major Asian exchanges—continues to broaden global institutional access channels. Investors continue to monitor ongoing network upgrades, validator staking dynamics, and broader macroeconomic liquidity indicators to determine when institutional buy-side demand will absorb the recent supply overhang and re-establish momentum.

Technical Analysis of Solana (SOLUSD)

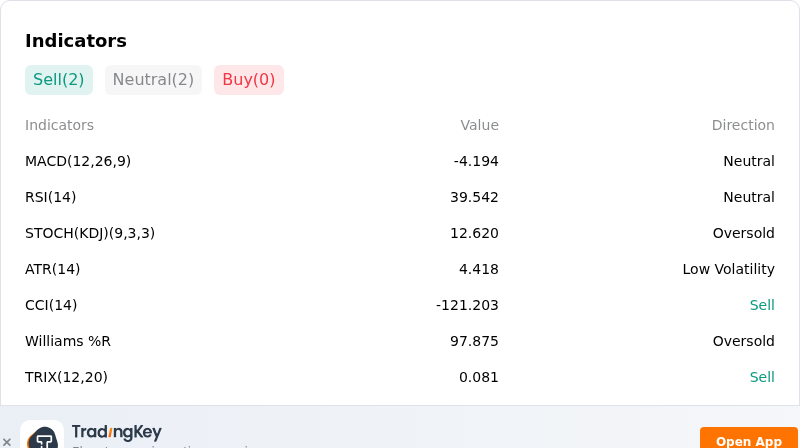
Technically, Solana (SOLUSD) shows a MACD (12,26,9) value of -4.194, indicating a neutral signal. The RSI at 39.542 suggests neutral condition and the Williams %R at 97.875 suggests oversold condition. Please monitor closely.
IndicatorAnalysis

More details about Solana (SOLUSD)

Recent Events and Risks:

  • Institutional Outflows from Spot Products: Solana-focused investment products recorded net capital outflows, signaling a softening in institutional buy-side support and leaving spot prices vulnerable to market pullbacks.
  • Derivatives Deleveraging and Long Liquidations: A technical breakdown below key support levels around $116–$117 triggered millions of dollars in forced long liquidations across major exchanges, compounding downward intraday momentum.
  • Whale Unstaking and CEX Inflows: On-chain data revealed massive token unstaking events and transfers from large wallets toward centralized exchange addresses, expanding the immediate liquid supply and creating potential spot sell pressure.
  • High-Beta Exposure to Macro Risk-Off Sentiment: Rising US Treasury yields, a strengthening US dollar, and hawkish monetary policy expectations have fueled broader risk-off market sentiment, leaving high-beta assets like Solana exposed to amplified percentage declines.
Disclaimer: For information purposes only. Past performance is not indicative of future results.
placeholder
October hike odds climb toward 60% as Goldman and BofA both flip — what Warsh's "dose of accommodation" really changedRate futures now price roughly 55% to 62% for a 25bp hike at the October 27-28 FOMC, up from about 30% before Chair Warsh's post-meeting framing that the Fed is merely "removing some accommodation." Goldman Sachs has added an October hike to its forecast and Bank of America now sees moves in both October and December. Here is the repricing, the language behind it, and the two data points that decide it.
Author  Irene Q.
Sep 23, Wed
Rate futures now price roughly 55% to 62% for a 25bp hike at the October 27-28 FOMC, up from about 30% before Chair Warsh's post-meeting framing that the Fed is merely "removing some accommodation." Goldman Sachs has added an October hike to its forecast and Bank of America now sees moves in both October and December. Here is the repricing, the language behind it, and the two data points that decide it.
placeholder
Hurricane Isaias has shut in a quarter of Gulf oil output — can WTI clear $92 before Thursday's EIA report?WTI trades at $90.80 after rebounding roughly 3% from Wednesday's $87.96 low as Hurricane Isaias — the Atlantic season's first — forces producers to shut in about 25% of US Gulf of Mexico output. Brent holds at $103.41. The first official read on the disruption arrives with the EIA weekly petroleum report on Thursday 15 October — here are the key levels and both scenarios.
Author  Irene Q.
Oct 09, Fri
WTI trades at $90.80 after rebounding roughly 3% from Wednesday's $87.96 low as Hurricane Isaias — the Atlantic season's first — forces producers to shut in about 25% of US Gulf of Mexico output. Brent holds at $103.41. The first official read on the disruption arrives with the EIA weekly petroleum report on Thursday 15 October — here are the key levels and both scenarios.
placeholder
US September CPI preview: inflation set to hit 3.7% — will the Fed hike in December?US September CPI lands Wednesday with headline inflation seen at 3.7% y/y and core at 0.2% m/m. December hike odds sit near 70% — here are the scenarios, the calendar and the key levels.
Author  Irene Q.
Oct 10, Sat
US September CPI lands Wednesday with headline inflation seen at 3.7% y/y and core at 0.2% m/m. December hike odds sit near 70% — here are the scenarios, the calendar and the key levels.
placeholder
Gold posts first weekly gain in three weeks — can $4,200 hold through CPI?Spot gold closed at $4,194.645, up 1.47% — its first weekly gain in three weeks — and COMEX futures settled back above $4,200 at $4,220.30. Here are the drivers, the levels and the scenarios into Wednesday's CPI.
Author  Irene Q.
Oct 10, Sat
Spot gold closed at $4,194.645, up 1.47% — its first weekly gain in three weeks — and COMEX futures settled back above $4,200 at $4,220.30. Here are the drivers, the levels and the scenarios into Wednesday's CPI.
placeholder
Brent swings $105.63 to $102.33 as Gulf risk meets an 'energy ceasefire' — can $100 hold into CPI?Brent spiked to $105.63 in Asian trade on fresh Middle East supply incidents, then reversed to $102.33 after the US announced a Russia-Ukraine 'energy ceasefire' and 300,000+ tonnes of Russian diesel headed to global markets; WTI fell through $90. Here are the drivers, the levels and the scenarios into Wednesday's US CPI.
Author  Irene Q.
22 hours ago
Brent spiked to $105.63 in Asian trade on fresh Middle East supply incidents, then reversed to $102.33 after the US announced a Russia-Ukraine 'energy ceasefire' and 300,000+ tonnes of Russian diesel headed to global markets; WTI fell through $90. Here are the drivers, the levels and the scenarios into Wednesday's US CPI.
goTop
quote