

Analog Devices Inc Stock (ADI) Moved Down by 3.50% on Oct 7: A Full Analysis

Source Tradingkey

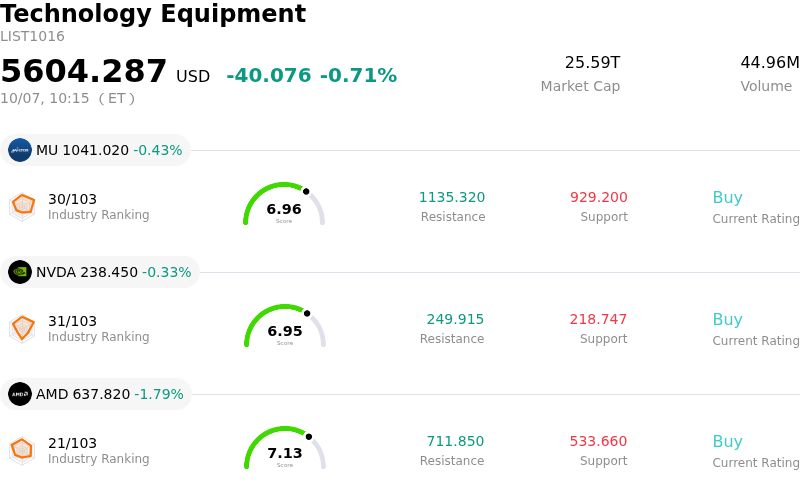
Analog Devices Inc (ADI) moved down by 3.50%. The Technology Equipment sector is down by 0.71%. The company underperformed the industry. Top 3 stocks by turnover in the sector: Micron Technology Inc (MU) down 0.38%; NVIDIA Corp (NVDA) down 0.32%; Advanced Micro Devices Inc (AMD) down 1.79%.
SummaryOverview

What is driving Analog Devices Inc (ADI)’s stock price down today?

Analog Devices experienced downward pressure and heightened intraday volatility as profit-taking swept through the semiconductor sector following a strong multi-week rally. After pushing toward multi-month high price levels on optimism around edge-computing artificial intelligence and an industrial cycle recovery, chipmakers faced broad-based consolidation as market participants locked in recent gains. The broader tech landscape saw increased rotation, leaving elevated valuation multiples vulnerable to short-term pullback.

The selling momentum was further catalyzed by regulatory disclosures indicating concentrated insider transactions. Multiple Form 4 filings revealed that key executives—including the Chief Executive Officer, Chief Operations and Technology Officer, and Chief Customer Officer—executed share sales in recent days. Although several of these transactions were conducted via pre-arranged automated trading plans, the cluster of executive liquidations near peak trading ranges dampened near-term investor sentiment, generating technical resistance during the session.

Despite the intraday retreat, fundamental operational drivers for the enterprise remain intact. Wall Street analysts continue to point to a resilient upcycle across analog, power discrete, and microcontroller segments, supported by expanding lead times and stable pricing power in core industrial and automotive end markets. However, in the immediate term, portfolio rebalancing and insider-driven sentiment headwinds outweighed favorable long-term industry fundamentals, driving the day's downward move.

Technical Analysis of Analog Devices Inc (ADI)

Technically, Analog Devices Inc (ADI) shows a MACD (12,26,9) value of 6.557, indicating a buy signal. The RSI at 60.913 suggests neutral condition and the Williams %R at 27.458 suggests buy condition. Please monitor closely.

Fundamental Analysis of Analog Devices Inc (ADI)

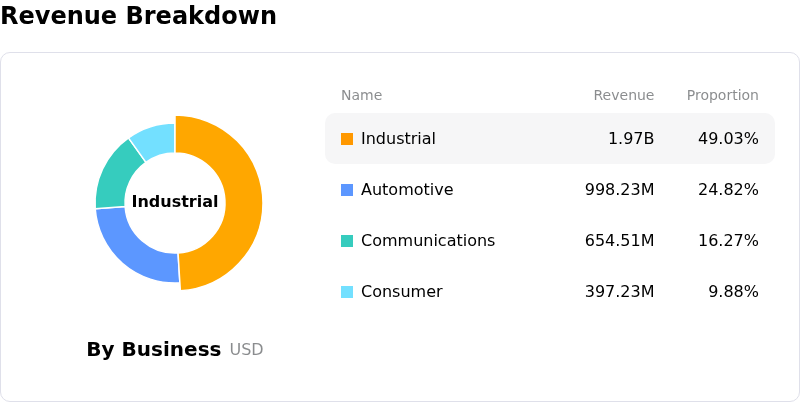
Analog Devices Inc (ADI) is in the Technology Equipment industry. Its latest annual revenue is $11.02B, ranking 18 in the industry. The net profit is $2.27B, ranking 14 in the industry. Company Profile
FundamentalAnalysis

Over the past month, multiple analysts have rated the company as Buy, with an average price target of $468.29, a high of $675.00, and a low of $315.00.

More details about Analog Devices Inc (ADI)

Company Specific Risks:

  • Insider Share Liquidations: Recent SEC Form 4 and Form 144 filings indicate significant insider sales by key executives, including Chief Customer Officer Katsufumi Nakamura and Officer Richard C. Puccio Jr., fueling market concerns over management profit-taking at current stock valuations.
  • Valuation Contraction and Sector Volatility: Trading at an elevated forward P/E multiple, analysts highlight that ADI's stock performance is decoupling from underlying fundamentals, leaving shares susceptible to multiple contraction during broad semiconductor sell-offs and interest rate fluctuations.
  • M&A Integration and Execution Exposure: Significant capital outlays for recent acquisitions, including the $1.35 billion purchase of Alif Semiconductor and the Empower Semiconductor integration, heighten integration and operational execution risks that could compress operating margins.
  • Cyclicality in Core End-Markets: Despite strength in AI data center demand, heavy revenue concentration in industrial and automotive analog markets leaves the business exposed to macro cooling, potential inventory resets, and customer spending delays.
Disclaimer: For information purposes only. Past performance is not indicative of future results.
placeholder
Gold ends three-week slide at the $4,400 line — eight straight days of ETF inflows vs a 5% 10-year and a 100 dollarSpot gold closed Friday at $4,378.39, up 0.84% on the day and about 0.8% for the week — its first weekly gain in four weeks — with the intraday high of $4,399.67 leaving it 33 cents shy of the $4,400 line. Gold ETFs have now logged eight straight sessions of inflows, but with the 10-year back above 5% and the dollar index near 100, here is what decides whether this is a reversal or a bounce.
Author  Suzie
Sep 20, Sun
Spot gold closed Friday at $4,378.39, up 0.84% on the day and about 0.8% for the week — its first weekly gain in four weeks — with the intraday high of $4,399.67 leaving it 33 cents shy of the $4,400 line. Gold ETFs have now logged eight straight sessions of inflows, but with the 10-year back above 5% and the dollar index near 100, here is what decides whether this is a reversal or a bounce.
placeholder
October hike odds climb toward 60% as Goldman and BofA both flip — what Warsh's "dose of accommodation" really changedRate futures now price roughly 55% to 62% for a 25bp hike at the October 27-28 FOMC, up from about 30% before Chair Warsh's post-meeting framing that the Fed is merely "removing some accommodation." Goldman Sachs has added an October hike to its forecast and Bank of America now sees moves in both October and December. Here is the repricing, the language behind it, and the two data points that decide it.
Author  Irene Q.
Sep 23, Wed
Rate futures now price roughly 55% to 62% for a 25bp hike at the October 27-28 FOMC, up from about 30% before Chair Warsh's post-meeting framing that the Fed is merely "removing some accommodation." Goldman Sachs has added an October hike to its forecast and Bank of America now sees moves in both October and December. Here is the repricing, the language behind it, and the two data points that decide it.
placeholder
Gold holds steady below $4,150 amid elevated US yields Gold price (XAU/USD) trades on a flat note near $4,140 during the early Asian session on Tuesday. Pressure from a stronger US Dollar (USD) and elevated US Treasury yields was offset by reduced expectations of a Federal Reserve (Fed) rate hike this month.
Author  FXStreet
Oct 06, Tue
Gold price (XAU/USD) trades on a flat note near $4,140 during the early Asian session on Tuesday. Pressure from a stronger US Dollar (USD) and elevated US Treasury yields was offset by reduced expectations of a Federal Reserve (Fed) rate hike this month.
placeholder
WTI rises to near $89.50 as Middle East supply threats offset Persian Gulf recoveryWest Texas Intermediate (WTI) oil price extends its gains for the second successive day, trading around $89.50 per barrel during the Asian hours on Wednesday. Crude oil climbed as persistent risks to Middle East energy flows overshadowed signs of rising supply from the region.
Author  FXStreet
Yesterday 01: 26
West Texas Intermediate (WTI) oil price extends its gains for the second successive day, trading around $89.50 per barrel during the Asian hours on Wednesday. Crude oil climbed as persistent risks to Middle East energy flows overshadowed signs of rising supply from the region.
placeholder
Gold Price Forecast: XAU/USD retraces gains and nears two-month lows at $4,104Gold (XAU/USD) retraces Tuesday’s gains on Wednesday and resumes its broader bearish trend, with the US Dollar (USD) appreciating across the board, as investors brace for the release of the minutes of the latest Federal Reserve (Fed) meeting.
Author  FXStreet
19 hours ago
Gold (XAU/USD) retraces Tuesday’s gains on Wednesday and resumes its broader bearish trend, with the US Dollar (USD) appreciating across the board, as investors brace for the release of the minutes of the latest Federal Reserve (Fed) meeting.
goTop
quote