

United Rentals Inc Stock (URI) Moved Down by 5.09% on Sep 29: Key Drivers Unveiled

Source Tradingkey

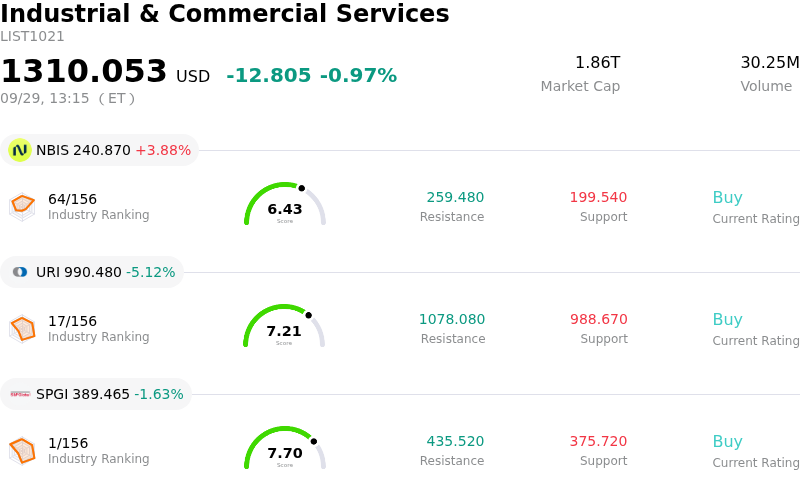
United Rentals Inc (URI) moved down by 5.09%. The Industrial & Commercial Services sector is down by 0.97%. The company underperformed the industry. Top 3 stocks by turnover in the sector: Nebius Group NV (NBIS) up 3.88%; United Rentals Inc (URI) down 5.12%; S&P Global Inc (SPGI) down 1.67%.
SummaryOverview

What is driving United Rentals Inc (URI)’s stock price down today?

United Rentals experienced significant downward pressure as a wave of selling in cyclical industrial equities triggered a technical breakdown below key psychological support levels. Rising Treasury yields and broader macroeconomic uncertainty concerning interest rate trajectories weighed heavily on capital-intensive sectors. Equipment rental platforms remain highly sensitive to borrowing costs and broader non-residential construction expectations, which prompted profit-taking following the stock's recent multi-month rally.

The pullback also reflects a valuation reset after weeks of strong momentum. Although long-term demand drivers remain supported by infrastructure spending, data center construction, and power grid projects, institutional sentiment has become increasingly divided. Recent analyst downgrades and growing scrutiny over valuation metrics have heightened market caution, with investors weighing near-term economic risks against long-term secular growth drivers.

Underlying cost pressures and high capital intensity continue to influence market sentiment. Despite solid operational performance and elevated full-year expectations, United Rentals faces margin headwinds stemming from fleet expansion expenses, higher depreciation costs, and elevated operating expenditures. The company's substantial capital commitment to maintain and expand its rental fleet requires disciplined execution, leaving limited room for operational slippage as investors demand sustained free cash flow generation.

Technical Analysis of United Rentals Inc (URI)

Technically, United Rentals Inc (URI) shows a MACD (12,26,9) value of 8.702, indicating a neutral signal. The RSI at 40.459 suggests neutral condition and the Williams %R at 75.170 suggests sell condition. Please monitor closely.

Fundamental Analysis of United Rentals Inc (URI)

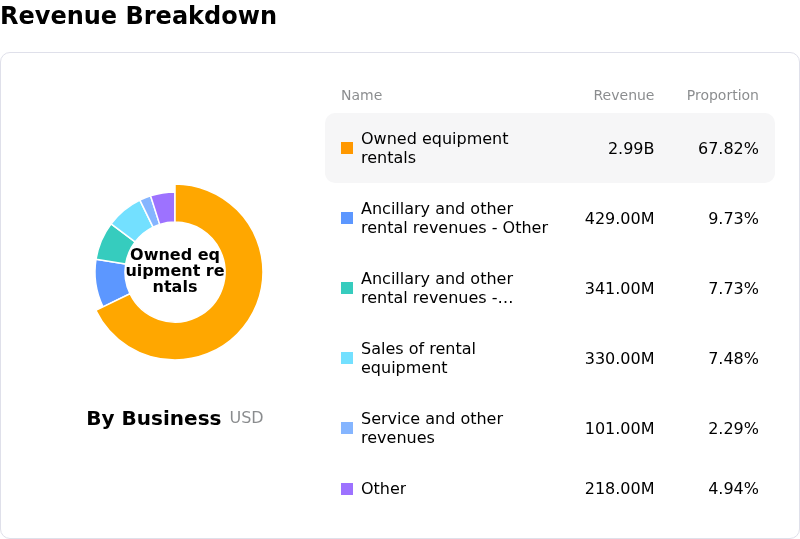
United Rentals Inc (URI) is in the Industrial & Commercial Services industry. Its latest annual revenue is $16.10B, ranking 7 in the industry. The net profit is $2.49B, ranking 6 in the industry. Company Profile
FundamentalAnalysis

Over the past month, multiple analysts have rated the company as Buy, with an average price target of $1257.03, a high of $1466.00, and a low of $950.00.

More details about United Rentals Inc (URI)

Company Specific Risks:

  • Analyst Downgrades and Exhausted M&A Runway: Wall Street research firms, including Zacks Research and JPMorgan, downgraded United Rentals away from buy ratings, citing a stretched valuation multiple, limited remaining upside, and a lack of large, attractive acquisition targets following extensive consolidation across the equipment rental market.
  • Intraday Technical Breakdown and Sector Contagion: Shares experienced heightened intraday selling pressure, sliding over 5% beneath the critical $1,000 technical anchor as negative pre-announcements from industrial and logistics peers sparked institutional risk-off rotation away from cyclical rental equipment equities.
  • Heavy Fleet Reinvestment Requirements and Leverage Exposures: Maintaining and upgrading United Rentals' $23.8 billion original equipment cost fleet requires continuous capital expenditure, which, combined with a debt-to-equity ratio of 1.38, threatens cash flow generation and debt-service capacity if broader economic activity moderates.
  • Operating Margin Compression from Fuel and Borrowing Costs: Rising operating overhead—driven by elevated diesel prices, higher maintenance costs, and persistent high interest rates—is creating margin pressure across general rental operations and increasing sensitivity to non-residential construction slowdowns.
Disclaimer: For information purposes only. Past performance is not indicative of future results.
placeholder
October hike odds climb toward 60% as Goldman and BofA both flip — what Warsh's "dose of accommodation" really changedRate futures now price roughly 55% to 62% for a 25bp hike at the October 27-28 FOMC, up from about 30% before Chair Warsh's post-meeting framing that the Fed is merely "removing some accommodation." Goldman Sachs has added an October hike to its forecast and Bank of America now sees moves in both October and December. Here is the repricing, the language behind it, and the two data points that decide it.
Author  Irene Q.
Sep 23, Wed
Rate futures now price roughly 55% to 62% for a 25bp hike at the October 27-28 FOMC, up from about 30% before Chair Warsh's post-meeting framing that the Fed is merely "removing some accommodation." Goldman Sachs has added an October hike to its forecast and Bank of America now sees moves in both October and December. Here is the repricing, the language behind it, and the two data points that decide it.
placeholder
Four jobs reports in five days: what JOLTS, ADP, claims and the September payrolls mean for the October Fed decisionThe US labour market faces its densest data week of the month. JOLTS job openings land Tuesday (7.2 million expected), ADP on Wednesday (70,000 expected), initial claims on Thursday and the September non-farm payrolls on Friday (100,000 expected, down from 162,000). Markets price a 64%-70% chance of another quarter-point Fed hike on October 28. The dollar index sits at 100.77 and the S&P 500 at 7,729.8.
Author  Mitrade
Sep 28, Mon
The US labour market faces its densest data week of the month. JOLTS job openings land Tuesday (7.2 million expected), ADP on Wednesday (70,000 expected), initial claims on Thursday and the September non-farm payrolls on Friday (100,000 expected, down from 162,000). Markets price a 64%-70% chance of another quarter-point Fed hike on October 28. The dollar index sits at 100.77 and the S&P 500 at 7,729.8.
placeholder
Nvidia's $150 billion buyback landed — and the AI sector fell anyway. That's the signal worth tradingNvidia closed up 1.68% at $228.86 on 28 September after announcing a $150 billion share repurchase authorisation, the largest single corporate buyback on record, while the rest of the AI complex sold off: AMD -3.6%, Micron -2.6%, Meta -4.8% and the Philadelphia Semiconductor Index -1.61%. The divergence is not noise. Capital is rotating toward cash-flow certainty, not abandoning the AI theme. With Micron reporting after the close on 30 September, here is what the split means.
Author  Irene Q.
Sep 29, Tue
Nvidia closed up 1.68% at $228.86 on 28 September after announcing a $150 billion share repurchase authorisation, the largest single corporate buyback on record, while the rest of the AI complex sold off: AMD -3.6%, Micron -2.6%, Meta -4.8% and the Philadelphia Semiconductor Index -1.61%. The divergence is not noise. Capital is rotating toward cash-flow certainty, not abandoning the AI theme. With Micron reporting after the close on 30 September, here is what the split means.
placeholder
【Daily Brief】30-year Treasury tops 5.59%, S&P 500 slips to 7,670 and gold holds $4,180 — PCE lands tonightThe 30-year Treasury yield closed at 5.59%, its highest since June 2002, and the Dow fell 131.59 points to 51,349.92. US consumer confidence dropped to 81.9, a 12-year low, and JOLTS job openings fell to 7.1 million. August PCE and Q3 GDP both land at 8:30am ET tonight.
Author  Suzie
Sep 30, Wed
The 30-year Treasury yield closed at 5.59%, its highest since June 2002, and the Dow fell 131.59 points to 51,349.92. US consumer confidence dropped to 81.9, a 12-year low, and JOLTS job openings fell to 7.1 million. August PCE and Q3 GDP both land at 8:30am ET tonight.
placeholder
Gold falls to near $4,150 as higher Treasury yields, oil prices outweigh softer PCE inflationGold price (XAU/USD) tumbles to near $4,150 during the early Asian session on Thursday, pressured by elevated US Treasury bond yields. Traders await the US September employment data for fresh impetus, which will be released later on Friday. 
Author  FXStreet
10 hours ago
Gold price (XAU/USD) tumbles to near $4,150 during the early Asian session on Thursday, pressured by elevated US Treasury bond yields. Traders await the US September employment data for fresh impetus, which will be released later on Friday. 
goTop
quote