

Bloom Energy Corp Stock (BE) Moved Up by 11.92% on Sep 29: What Signal Does It Send?

Source Tradingkey

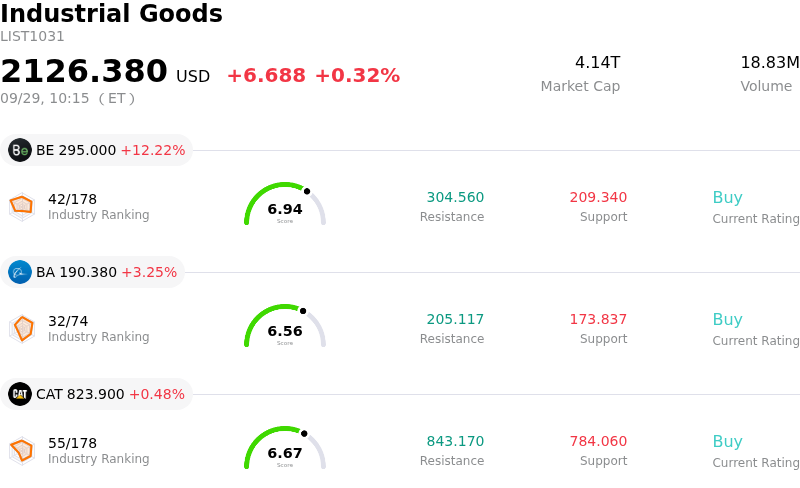
Bloom Energy Corp (BE) moved up by 11.92%. The Industrial Goods sector is up by 0.32%. The company outperformed the industry. Top 3 stocks by turnover in the sector: Bloom Energy Corp (BE) up 11.92%; Boeing Co (BA) up 3.28%; Caterpillar Inc (CAT) up 0.48%.
SummaryOverview

What is driving Bloom Energy Corp (BE)’s stock price up today?

Bloom Energy Corporation registered a substantial rebound following a sharp previous-session pullback, fueled by company reassurances regarding a key customer project, bullish analyst commentary, and aggressive manufacturing expansion plans. Investor sentiment turned sharply positive after the company clarified that Oracle Corporation reaffirmed its commitment to the multi-gigawatt fuel cell deployment under Project Jupiter. While natural gas pipeline permitting delays pushed certain utility timelines into early 2027, the deployment remains aligned with Oracle's overall project schedule, effectively alleviating market concerns regarding potential contract deferrals or near-term revenue disruption.

Further driving the upward momentum was a strong vote of confidence from Wall Street research firms. RBC Capital reiterated its bullish stance, pointing to Bloom Energy's decision to lease an additional 158,000 square feet at its Fremont, California facility. By nearly doubling its existing manufacturing footprint, the expansion provided tangible evidence that customer demand for clean, on-site fuel cell servers continues to run ahead of previous forecasts. Additionally, Jefferies raised its price target on the stock, reinforcing that the core strategy of providing behind-the-meter power solutions for data center operators remains intact.

The rally underscores broader institutional confidence in Bloom Energy's positioning within the rapidly expanding artificial intelligence and data infrastructure ecosystem. As hyperscale data centers face severe electrical grid capacity bottlenecks and prolonged interconnection queues, Bloom's solid oxide fuel cells offer an immediate, grid-independent power alternative. Supported by a expanding pipeline of major commercial and energy partnerships, structural buying demand from recent index inclusions, and market adoption of its high-voltage direct current architecture, the stock continues to attract strong capital flows as investors look past short-term timing friction toward multi-year operational growth.

Technical Analysis of Bloom Energy Corp (BE)

Technically, Bloom Energy Corp (BE) shows a MACD (12,26,9) value of 1.984, indicating a buy signal. The RSI at 61.168 suggests neutral condition and the Williams %R at 0.258 suggests overbought condition. Please monitor closely.

Media Coverage of Bloom Energy Corp (BE)

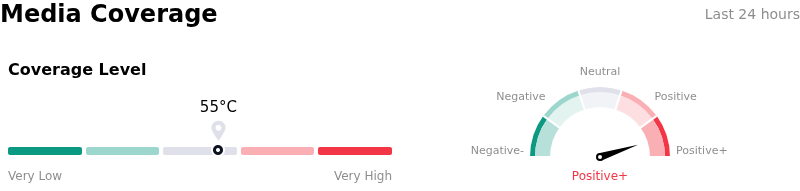
In terms of media coverage, Bloom Energy Corp (BE) shows a coverage score of 55, indicating a moderate level of media attention. The overall market sentiment index is currently in extremely bullish zone.
SentimentAnalysis

Fundamental Analysis of Bloom Energy Corp (BE)

Bloom Energy Corp (BE) is in the Industrial Goods industry. Its latest annual revenue is $2.02B, ranking 78 in the industry. The net profit is $-88.43M, ranking 210 in the industry. Company Profile

Over the past month, multiple analysts have rated the company as Buy, with an average price target of $269.85, a high of $354.00, and a low of $98.94.

More details about Bloom Energy Corp (BE)

Company Specific Risks:

  • Project Jupiter Deferral and Revenue Recognition Risk: Oracle's invocation of force majeure on its New Mexico Project Jupiter data center due to natural gas pipeline permitting delays through early 2027 threatens immediate deployments of Bloom's fuel-cell servers and risks deferring short-term top-line revenue recognition.
  • Securities Class Action Litigation Overhang: The company is confronting heightened legal scrutiny as a key September 28, 2026 lead-plaintiff deadline arrived in ongoing federal class action litigation, which alleges management made misleading disclosures regarding its supply chain reliance on Chinese-sourced scandium oxide.
  • Exhaustion of Benchmark Rebalancing Catalysts: Following the completion of implementation dates for major benchmark inclusions—such as the FTSE All-World Index—mechanical institutional buying has subsided, triggering aggressive profit-taking and intraday volatility following a massive year-to-date share price surge.
  • Stretched Valuation Multiples and Execution Vulnerability: Operating at a forward price-to-earnings ratio above 100x alongside substantial balance sheet leverage, institutional analysts caution that the stock remains highly vulnerable to sharp re-ratings if power delivery schedules or commercial deployments suffer further operational delays.
Disclaimer: For information purposes only. Past performance is not indicative of future results.
placeholder
October hike odds climb toward 60% as Goldman and BofA both flip — what Warsh's "dose of accommodation" really changedRate futures now price roughly 55% to 62% for a 25bp hike at the October 27-28 FOMC, up from about 30% before Chair Warsh's post-meeting framing that the Fed is merely "removing some accommodation." Goldman Sachs has added an October hike to its forecast and Bank of America now sees moves in both October and December. Here is the repricing, the language behind it, and the two data points that decide it.
Author  Irene Q.
Sep 23, Wed
Rate futures now price roughly 55% to 62% for a 25bp hike at the October 27-28 FOMC, up from about 30% before Chair Warsh's post-meeting framing that the Fed is merely "removing some accommodation." Goldman Sachs has added an October hike to its forecast and Bank of America now sees moves in both October and December. Here is the repricing, the language behind it, and the two data points that decide it.
placeholder
Four jobs reports in five days: what JOLTS, ADP, claims and the September payrolls mean for the October Fed decisionThe US labour market faces its densest data week of the month. JOLTS job openings land Tuesday (7.2 million expected), ADP on Wednesday (70,000 expected), initial claims on Thursday and the September non-farm payrolls on Friday (100,000 expected, down from 162,000). Markets price a 64%-70% chance of another quarter-point Fed hike on October 28. The dollar index sits at 100.77 and the S&P 500 at 7,729.8.
Author  Mitrade
Sep 28, Mon
The US labour market faces its densest data week of the month. JOLTS job openings land Tuesday (7.2 million expected), ADP on Wednesday (70,000 expected), initial claims on Thursday and the September non-farm payrolls on Friday (100,000 expected, down from 162,000). Markets price a 64%-70% chance of another quarter-point Fed hike on October 28. The dollar index sits at 100.77 and the S&P 500 at 7,729.8.
placeholder
Nvidia's $150 billion buyback landed — and the AI sector fell anyway. That's the signal worth tradingNvidia closed up 1.68% at $228.86 on 28 September after announcing a $150 billion share repurchase authorisation, the largest single corporate buyback on record, while the rest of the AI complex sold off: AMD -3.6%, Micron -2.6%, Meta -4.8% and the Philadelphia Semiconductor Index -1.61%. The divergence is not noise. Capital is rotating toward cash-flow certainty, not abandoning the AI theme. With Micron reporting after the close on 30 September, here is what the split means.
Author  Irene Q.
Yesterday 06: 31
Nvidia closed up 1.68% at $228.86 on 28 September after announcing a $150 billion share repurchase authorisation, the largest single corporate buyback on record, while the rest of the AI complex sold off: AMD -3.6%, Micron -2.6%, Meta -4.8% and the Philadelphia Semiconductor Index -1.61%. The divergence is not noise. Capital is rotating toward cash-flow certainty, not abandoning the AI theme. With Micron reporting after the close on 30 September, here is what the split means.
placeholder
The 30-year Treasury just hit a 22-year high — and the bond market is not pricing the Fed, it is pricing the deficitThe 30-year Treasury yield closed at 5.56% on 28 September, the highest since June 2004, while the 10-year reached 5.24% and the 20-year 5.60%. The curve has steepened roughly 30bp in eight sessions even as October hike odds sit at 70.3%. That gap is the story: the long end is repricing fiscal and inflation risk, not policy. With PCE on Wednesday and payrolls on Friday, here is what the long end is really saying.
Author  Irene Q.
Yesterday 07: 08
The 30-year Treasury yield closed at 5.56% on 28 September, the highest since June 2004, while the 10-year reached 5.24% and the 20-year 5.60%. The curve has steepened roughly 30bp in eight sessions even as October hike odds sit at 70.3%. That gap is the story: the long end is repricing fiscal and inflation risk, not policy. With PCE on Wednesday and payrolls on Friday, here is what the long end is really saying.
placeholder
【Daily Brief】30-year Treasury tops 5.59%, S&P 500 slips to 7,670 and gold holds $4,180 — PCE lands tonightThe 30-year Treasury yield closed at 5.59%, its highest since June 2002, and the Dow fell 131.59 points to 51,349.92. US consumer confidence dropped to 81.9, a 12-year low, and JOLTS job openings fell to 7.1 million. August PCE and Q3 GDP both land at 8:30am ET tonight.
Author  Suzie
2 hours ago
The 30-year Treasury yield closed at 5.59%, its highest since June 2002, and the Dow fell 131.59 points to 51,349.92. US consumer confidence dropped to 81.9, a 12-year low, and JOLTS job openings fell to 7.1 million. August PCE and Q3 GDP both land at 8:30am ET tonight.
goTop
quote