


Silver (XAGUSD) Drops on Sep 23: What Lie behind the Move?
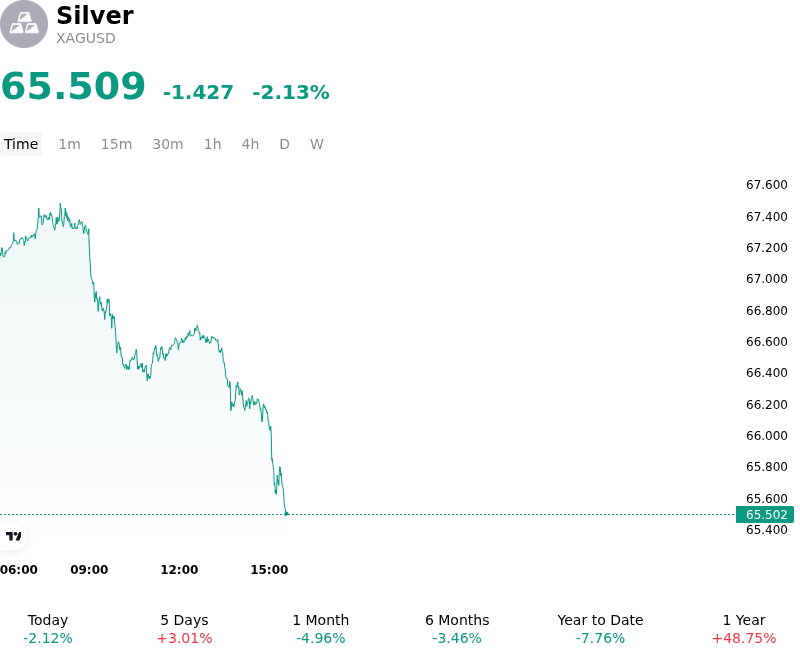
Silver (XAGUSD) is down 2.13% at Sep 23 03:35(ET), now at $65.509, with a 7-day up of 4.12%.
What is driving Silver (XAGUSD)’s stock price down today?
The retreat in spot silver was primarily driven by a firmer U.S. dollar and fresh hawkish commentary from Federal Reserve officials, which prompted institutional investors to recalibrate interest-rate expectations following the central bank's recent policy tightening. Statements from Fed policymakers emphasizing persistent inflation risks and the potential need for additional rate hikes buoyed U.S. Treasury yields and supported the U.S. Dollar Index. As a non-yielding asset, silver faced immediate selling pressure from the rising opportunity cost of holding precious metals compared to interest-bearing instruments, triggering a wave of long liquidation across leveraged paper markets.
Silver's relative underperformance compared to gold was reflected in a widening gold-silver ratio, a clear signature of a macro-driven, rate-sensitive pullback rather than a structural deterioration in physical consumption. While long-term industrial demand from the solar photovoltaic, power electronics, and automotive sectors remains fundamentally sound, short-term financial capital flows dominated session price action. As macro traders trimmed exposure to precious metals proxies, silver's higher beta and smaller market liquidity amplified the downward move relative to bullion. Additionally, a broader pullback in global energy prices moderated short-term inflation expectations, removing a catalyst that had recently supported precious metals.
From a technical perspective, the decline gathered momentum after silver failed to clear key overhead resistance near the upper boundary of its multi-week trading range. The failure at resistance prompted systematic profit-taking and triggered automated stop-loss orders below intermediate support levels. Although physical supply deficits and steady coin and bar premiums continue to provide a long-term floor for the market, near-term price action remains constrained by U.S. dollar strength and shifting central-bank policy expectations. Until real yields stabilize and interest-rate clarity emerges, paper silver positions are likely to experience continued volatility.
Technical Analysis of Silver (XAGUSD)
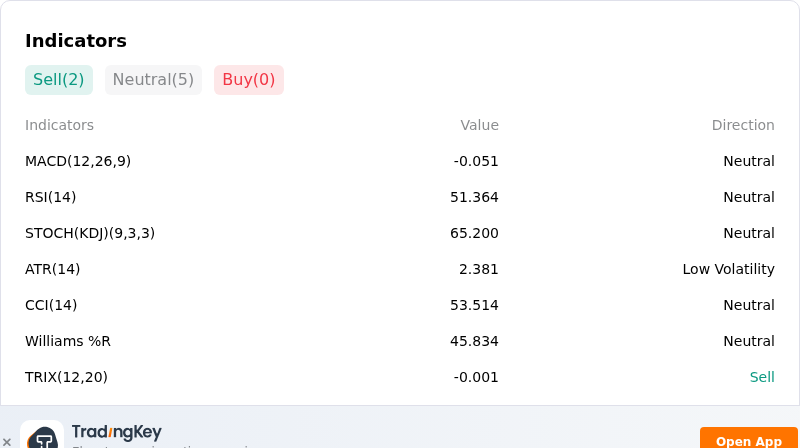
Technically, Silver (XAGUSD) shows a MACD (12,26,9) value of -0.051, indicating a neutral signal. The RSI at 51.364 suggests neutral condition and the Williams %R at 45.834 suggests neutral condition. Please monitor closely.
More details about Silver (XAGUSD)
Recent Events and Risks:
- Hawkish Federal Reserve Outlook and Rising Yields: The Fed's recent interest rate hike to a 3.75%–4.00% target range, combined with hawkish guidance and elevated inflation indicators, has significantly raised real Treasury yields. This dynamic increases the opportunity cost of holding non-yielding spot silver, exerting downward pressure on XAGUSD during intraday trading.
- U.S. Dollar Strength and Position Unwinding: Sustained strength in the U.S. Dollar Index consolidating above key threshold levels has created strong macro headwinds for dollar-denominated precious metals. The resulting currency strength has forced momentum traders to unwind speculative long positions, dragging silver down from its upper trading band near $68.00.
- Easing Geopolitical Risk Premiums and Energy Prices: Diplomatic talks between U.S. and Iranian envoys at the United Nations General Assembly have moderated Middle Eastern geopolitical supply risks and stabilized crude oil markets. The easing of energy-driven inflationary pressures has reduced immediate institutional hedging demand for silver.
- Technical Overhead Resistance and Downside Channel Risk: XAGUSD's repeated failure to break above strong technical resistance near $68.00 has accelerated short-term liquidation. Falling below key short-term moving averages exposes the metal to increased intraday volatility and downside risk toward lower structural support zones around $62.30 to $60.90.
Recommended Articles


